for institutional deal workflows


Ask five professionals what yield an office building trades on and you will get five different numbers, all technically correct. The agent quotes a core market yield. The valuer solves for an equivalent yield. The vendor's flyer leads with the fully-leased yield. The listed market reports an initial yield. The fund manager ignores all four and runs a discounted cash flow to an IRR. Same building, same price, five numbers, and in my experience the definitions and conventions behind each vary a surprising amount across the market.
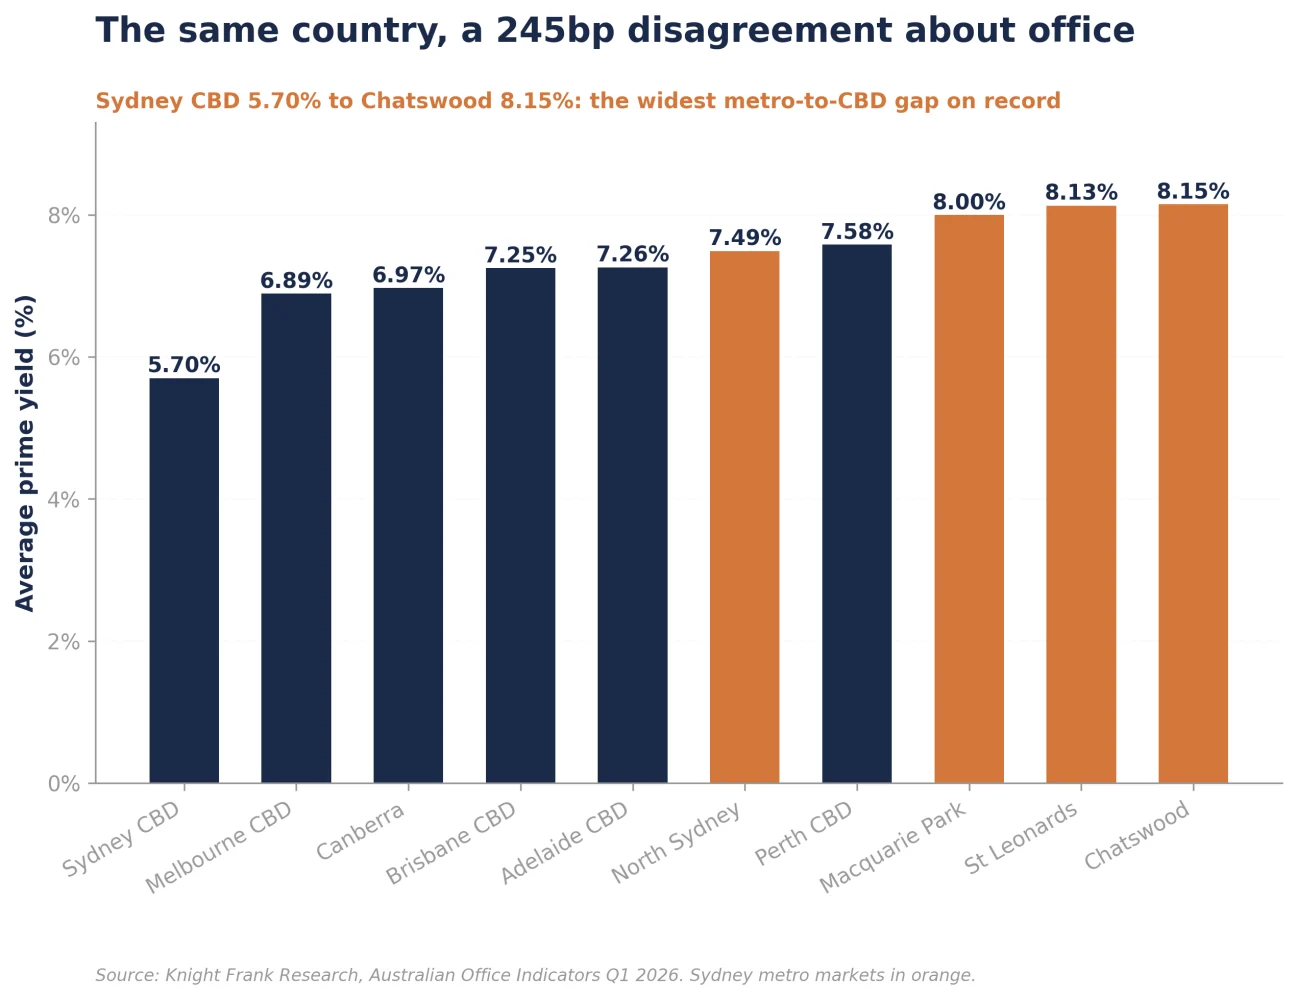
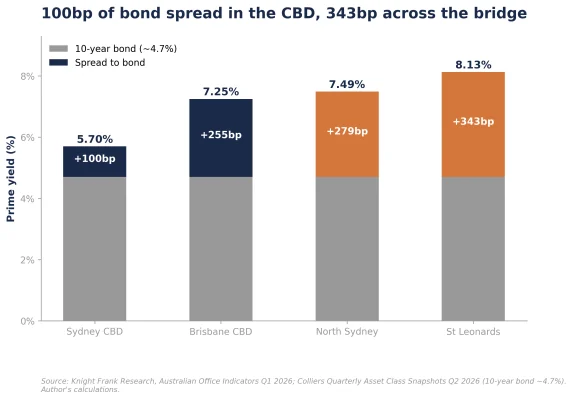
This matters more right now than it has in a decade. Australian office is quoting the widest set of yields in its modern history: prime Sydney CBD assets at 5.70% sit in the same country as St Leonards assets at 8.13% (Knight Frank, Australian Office Indicators Q1 2026), and with incentives running anywhere from the high-20s to 55% depending on the market, the gap between the rent on the lease and the rent actually being paid has rarely been wider. When the numbers disagree this much, knowing precisely what each one measures is critical.
This piece is more educational/mathematical than my usual market reads but I think it is quite revealing. We will build a stylised metro office tower from published market averages, price it four different ways, and show what each yield is really telling you, before finishing with the three places the vocabulary quietly alters acquisitions.
The Market Snapshot: What the Brokers Are Saying
Knight Frank publishes the cleanest single table of the yield landscape. As at Q1 2026, average prime office yields run from 5.70% in the Sydney CBD, through 6.89% in Melbourne and 7.25% in Brisbane, out to 7.49% in North Sydney, 8.13% in St Leonards and 8.15% in Chatswood (Knight Frank, Australian Office Indicators Q1 2026). The spread between North Sydney and the Sydney CBD stands at around 180 basis points, the highest on record (Knight Frank, North Shore Office Market H1 2026). Note the label on that table: "core market yield, assuming WALE 5 years". The most-quoted yield in Australian real estate is, by its own footnote, a normalised construct rather than the arithmetic of any actual building.
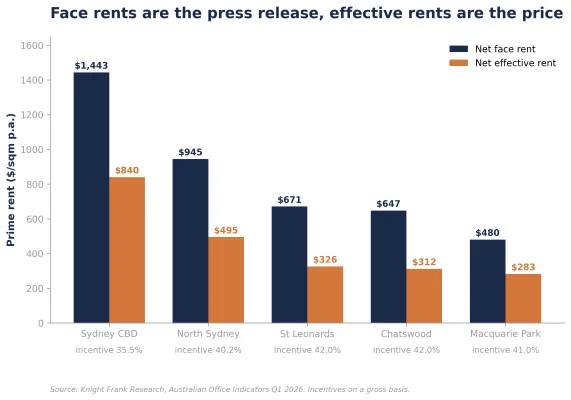
The same table quietly demonstrates the rent problem. Sydney CBD prime net face rents average $1,443/sqm but net effective rents are $840/sqm after 35.5% incentives; in St Leonards the gap is $671 face against $326 effective after 42% incentives (Knight Frank, Australian Office Indicators Q1 2026). And in a detail that proves how confused the vocabulary is, Knight Frank quotes Sydney and Brisbane incentives on a gross rent basis but Melbourne and Perth on a net rent basis, in the same table. Even the very best research houses don't always standardise the denominator.
Transactions anchor this ladder. 100 Mount Street in North Sydney sold at approximately a 6.9% core market yield, 100 Pacific Highway at 8.1%, and a stake in Sydney's Salesforce Tower at 5.5% (Knight Frank, Australian Office Indicators Q1 2026; Knight Frank, North Shore Office Market H1 2026). Three buildings, three yields, one market. The rest of this piece is about what those numbers actually mean.
One Building, Four Yields: The Maths
To see what each yield actually measures, build a tower out of the published averages. Take a stylised 20,000 sqm A-grade metro office asset, St Leonards flavoured: net face rents of $670/sqm, outgoings of $150/sqm (so $820/sqm gross), 25% of the building vacant, in a market where new leases carry 42% incentives on five-year terms and the average core market yield is 8.13% (we will define this in next paragraph; all inputs from Knight Frank, Australian Office Indicators Q1 2026). Fully leased, it earns $13.4m net. Today the occupied floors pay $10.05m, but the owner also wears about $0.75m of outgoings on the empty quarter of the building (on a net lease, nobody reimburses the outgoings on vacant space), so true net passing income is roughly $9.3m. That leakage line is the first place quick yield calculations go wrong.
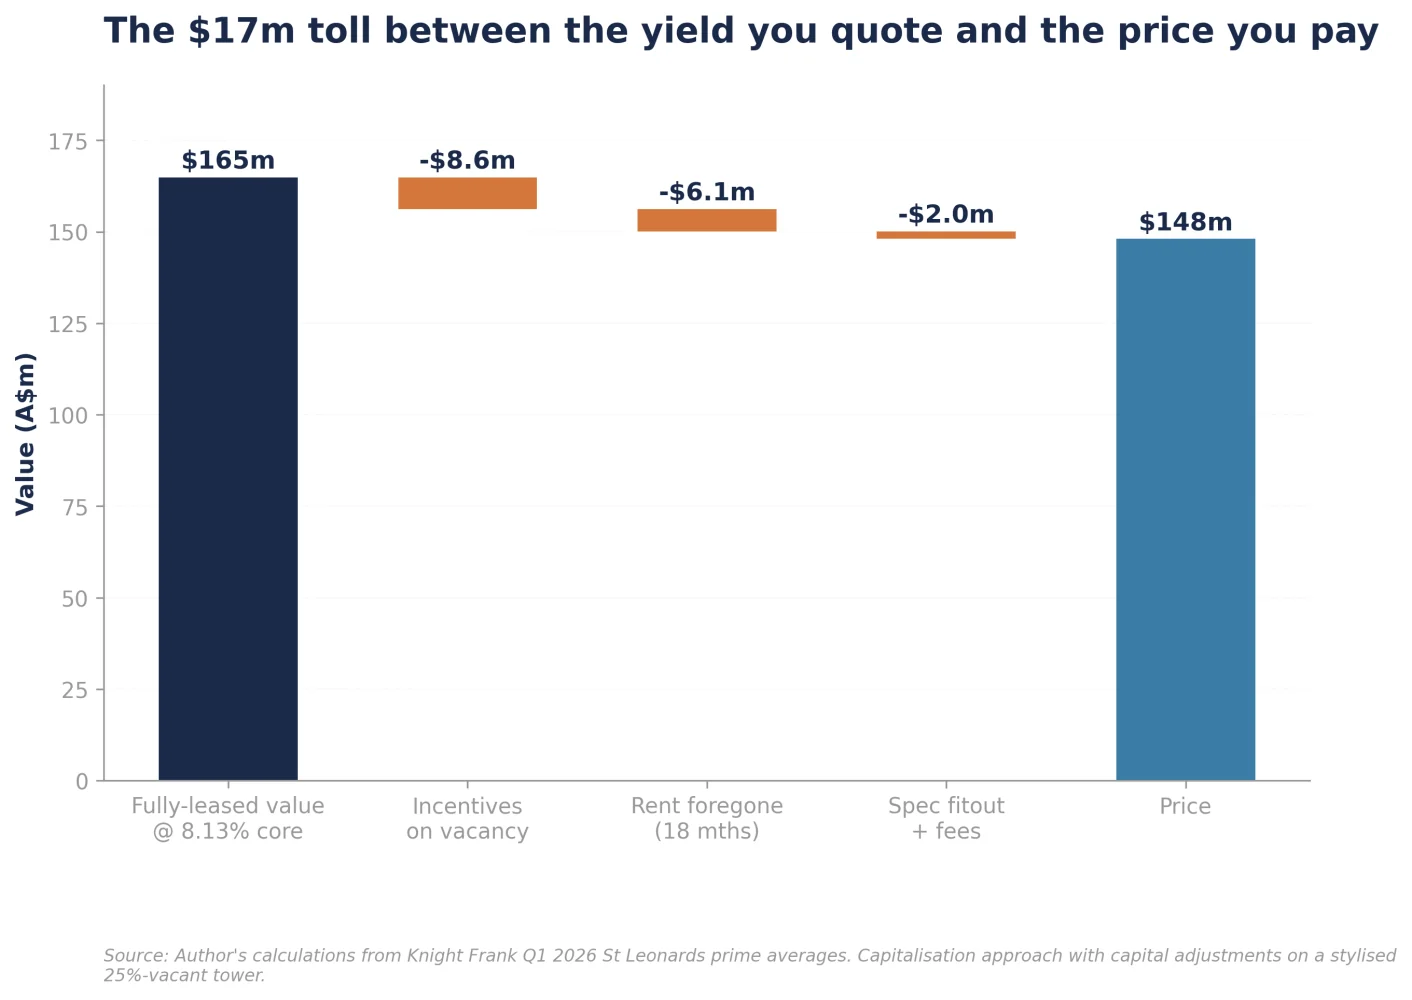
The core market yield is how the market would price it. Capitalise the fully-leased income at the core yield, then deduct, dollar for dollar, everything it costs to get from the building you are buying to the stabilised building you capitalised: roughly $8.6m of incentives on the vacant floors, $6.2m of rent foregone over an 18-month letting-up, and about $2m of fees and spec fitout, call it $16.8m of "capital adjustments". Value: $13.4m ÷ 8.13% = $164.8m, less $16.8m, or about $148m (author's calculations).
Read backwards, the core cap is the yield the price implies after you normalise away the asset's specific mess. That is exactly why the market uses it: it lets a 25%-vacant tower sit in a comparables table next to a fully-let one on like terms. It is a comparability convention, not a return. This formula is below and is the way I think about it.
Core market yield = fully-leased net market income ÷ (sale price + capital adjustments)
The 8.13% itself is not invented; it is averaged out of recent sales, each one reverse-engineered through this same equation, which is why the method is circular by design: it prices your building off what the last buyer paid for theirs
Note: One-off capex to reach stabilisation belongs in the adjustments; recurring capex through the hold is already priced inside the yield, which is part of why capex-hungry office trades wider than industrial
The initial yield is the arithmetic of today: $9.3m ÷ $148m = 6.3%. It is what the building actually pays you at settlement, outgoings leakage and all, and it ignores the reversion entirely.
The fully-leased yield is the arithmetic of the destination: $13.4m ÷ $148m = 9.1%. It pretends the reversion is free and instant.
The equivalent yield is the honest one. It is the single rate Y that makes the actual staged package equal the price: the passing income for as long as it lasts, plus the market income capitalised in perpetuity but deferred until the vacancy actually leases, minus the present value of the letting costs. Y appears in every term, so you cannot rearrange for it; like an IRR, you solve it iteratively. On our tower it lands at about 8.2% (my calculation).
The ordering is a structural property of any under-rented or vacancy deal: initial < core/equivalent < fully-leased, here 6.3% < 8.1-8.2% < 9.1% (on an over-rented asset the ordering flips, which is itself a useful diagnostic). The roughly 80 basis points between the equivalent and fully-leased yields is literally the annualised toll of waiting for, and paying for, the lease-up. That is why the equivalent yield is the best single answer to "what am I really paying": it is the only one that charges you for time and friction.
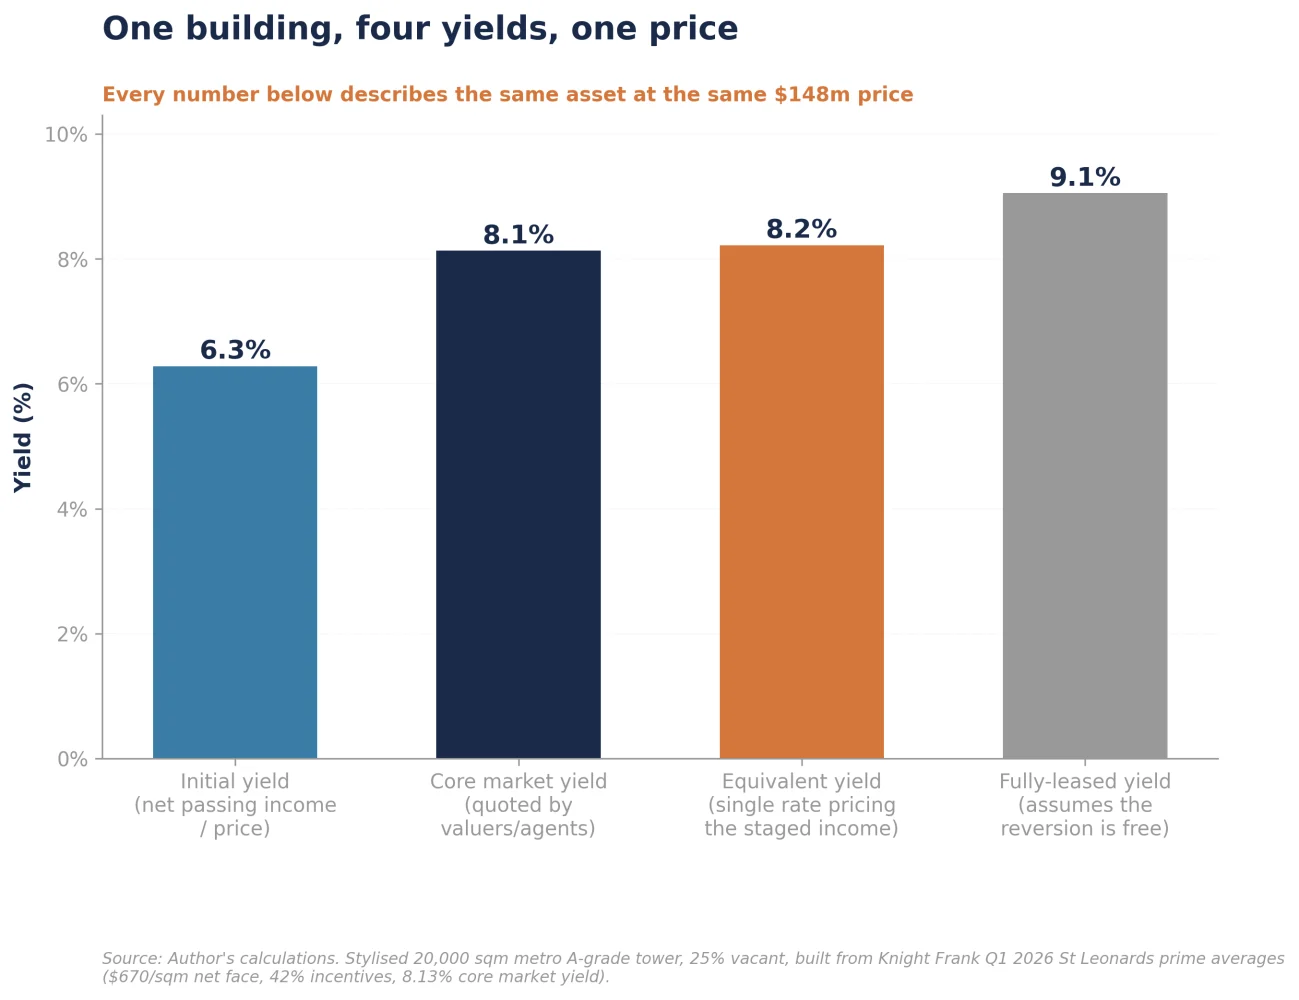
One corollary worth carrying into a negotiation: the core cap and the incentive assumption are two inputs for one output. Hold the price at $148m and move assumed incentives from 42% to 35%, and the implied core yield changes with it. When an agent quotes one core yield and a buyer quotes another on the same asset at similar prices, they usually are not disagreeing about the market. They are disagreeing about leasing costs.
View 1: Incentives Are the Market's Confession
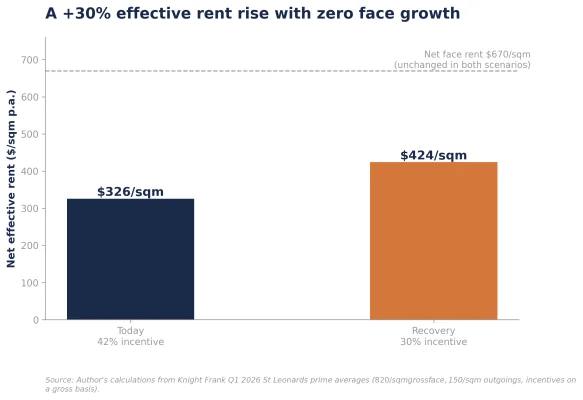
Face and effective, gross and net, are two independent dimensions, and confusing them is the most expensive vocabulary error in Australian leasing. Gross versus net is about who pays the outgoings. Face versus effective is about whether the incentive is counted. On our stylised tower, the four cells of that 2x2 run from $820/sqm (gross face) down to $326/sqm (net effective). Read that again: the market's true clearing price for this space is $326 against a $670 net face rent. The tenant genuinely pays about half the headline. Real deals confirm the scale: PepsiCo's recent North Sydney commitment was struck at a 55% incentive (Knight Frank, North Shore Office Market H1 2026).
The market maintains the fiction for rational reasons. Valuers capitalise face income, so a landlord who cuts face rent 20% instead of paying an incentive marks down every valuation in the submarket and tests their LVR covenants; an incentive is a one-off cost, a face cut is a permanent repricing. Rent reviews compound off face, so protecting the headline protects the whole income trajectory. And face rents leak to other tenants while incentive deeds stay confidential.
The consequence is that recoveries show up as incentive compression long before face growth. If our market's incentives fall from 42% to 30% as vacancy is absorbed, net effective rents rise from $326 to $424/sqm, a 30% increase with zero face rent growth. This is not hypothetical mechanics: Knight Frank recorded exactly the reverse in Chatswood last year, where a rise in incentives from 38% to 42% turned flat face rents into an 8.5% fall in effective rents (Knight Frank, North Shore Office Market H1 2026). Whichever direction the cycle runs, the effective number moves first and hardest. Anyone forecasting, or valuing, off face rents is watching the wrong pipe.
View 2: The Metro Spread, Decomposed
St Leonards at 8.13% against the Sydney CBD at 5.70% looks like a 243 basis point free lunch. The vocabulary explains why it is not, and also why it is still interesting.
First, remember what the core yield has already stripped out. Because the quoted yield sits behind the capital adjustments, the metro number is not inflated by lease-up friction; the incentives and downtime were deducted in dollars before the yield was struck. The 243 points is therefore close to a genuine difference in the price of risk: weaker tenant depth (St Leonards total vacancy is 29.1% against the Sydney CBD's 13.8%), thinner buyer liquidity, and lower expected effective rent growth (Knight Frank, Australian Office Indicators Q1 2026).
Second, put both numbers against the bond. With the 10-year near 4.7% (Colliers, Quarterly Asset Class Snapshots Q2 2026), prime Sydney CBD offers roughly 100 basis points of spread, while St Leonards offers about 343 (author's calculations). The CBD number prices continued compression and rent growth close to perfection; the metro number prices very little going right. Yields there have already softened by some 271 basis points since mid-2021 in North Sydney's case (Knight Frank, North Shore Office Market H1 2026), while the supply side has gone quiet: beyond the small projects currently underway, the North Shore development pipeline is not expected to materially add to supply before 2030 (Knight Frank, North Shore Office Market H1 2026).
The question is never "is 8% cheap against 5.7%". It is: how many of those 243 points are compensation for risks you can underwrite (letting-up you can model, incentives you can fund), and how many for risks you cannot (structural tenant demand). The first kind of risk is where returns are made; the second is where capital is lost.
View 3: The IRR Is a Yield Plus a Growth Guess
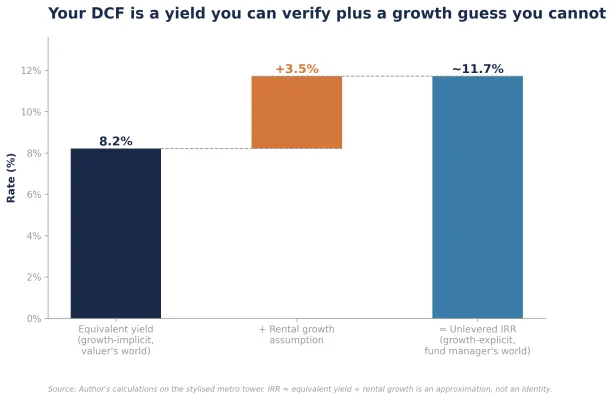
The last confusion is the deepest one: the valuer's world and the fund manager's world run on different physics. Every yield discussed so far is growth-implicit: by convention it values everything at today's rents and projects nothing. A DCF discount rate or IRR is growth-explicit: the cash flows already contain your rental growth assumption. The bridge between the two worlds is beautifully simple:
IRR ≈ equivalent yield + rental growth
On our tower: an 8.2% equivalent yield plus, say, 3.5% per annum rental growth gives an unlevered IRR of roughly 11.7% (author's calculations). It is an approximation rather than an identity, but it reconciles remarkably well in practice, and it is the single most useful sanity check in underwriting. When someone quotes you a yield, first establish which side of the bridge they are standing on. Then use the bridge to interrogate them: a fund manager pitching a 14% unlevered IRR off an asset whose equivalent yield is 8% is, whether they say so or not, assuming roughly 6% annual rental growth. Say it that way and the assumption suddenly has to defend itself.
The bridge also exposes what a DCF really is. The equivalent yield half you can verify against transactions today. The growth half is a guess about the future, and View 1 tells you it is an even trickier guess than it looks, because growth arrives through incentive compression before it ever touches face rents. Two models can key identical face growth and differ enormously in effective rent growth purely through their incentive taper. The sophistication of a 10-year monthly cash flow is mostly presentation; the model is a yield you can check plus a growth bet.
Where This Goes From Here
So what is the right yield to value real estate with? The honest answer is that the question is malformed. Each yield answers a different question. The initial yield answers "what does it pay me today". The fully-leased yield answers "what could it pay". The core market yield answers "how does this price compare to other buildings". The equivalent yield answers "what am I really earning after time and friction". The IRR answers "what do I make if my growth guess is right". The expensive mistakes in this industry rarely come from picking the wrong asset; they come from answering question A with yield B: comparing an initial yield on a vacant building to a core yield on a full one, capitalising face rents through a 42% incentive market, or treating an IRR as evidence rather than as a yield plus an assumption.
My practical checklist, in one paragraph. Establish the basis of every number you are quoted: face or effective, gross or net, and, for the incentive, which rent it is a percentage of. Ask whether the yield is before or after capital adjustments, and what incentive assumption sits inside it. On any vacancy or reversion asset, insist on the equivalent yield, because it is the only number that charges for time. And bridge every IRR back to yield plus growth, then debate the growth, because that is where the real bet always lives.
My view: in a market where the CBD-to-metro yield gap is the widest on record and incentives are doing all the price discovery, the investors who win the next few years will not be the ones with better information. The vocabulary is public; Knight Frank prints the whole table. They will be the ones who actually do the maths on numbers everyone else is content to quote.
Sources
- Knight Frank Research, Australian Office Indicators Q1 2026, https://content.knightfrank.com/research/2910/documents/en/australian-office-indicators-q1-2026-12815.pdf
- Knight Frank Research, North Shore Office Market H1 2026, February 2026, https://content.knightfrank.com/research/444/documents/en/north-shore-office-market-february-2026-12729.pdf
- CBRE Research, Australia CBD Office Figures Q2 2026, https://www.cbre.com.au/insights/figures/australia-cbd-office-figures-q2-2026
- CBRE Research, Pacific Real Estate Market Outlook 2026, https://www.cbre.com.au/insights/reports/pacific-real-estate-market-outlook-2026
- JLL Research, Australian office markets showed resilience through Q2, 9 July 2026, https://www.jll.com/en-au/newsroom/australian-office-markets-showed-resilience-through-q2
- JLL Research, Sydney Office Market Dynamics Q2 2026, https://www.jll.com/en-au/insights/market-dynamics/sydney-office
- Colliers, Quarterly Asset Class Snapshots Q2 2026, https://www.colliers.com.au/en-au/research/quarterly-asset-class-snapshots-q2-2026