for institutional deal workflows


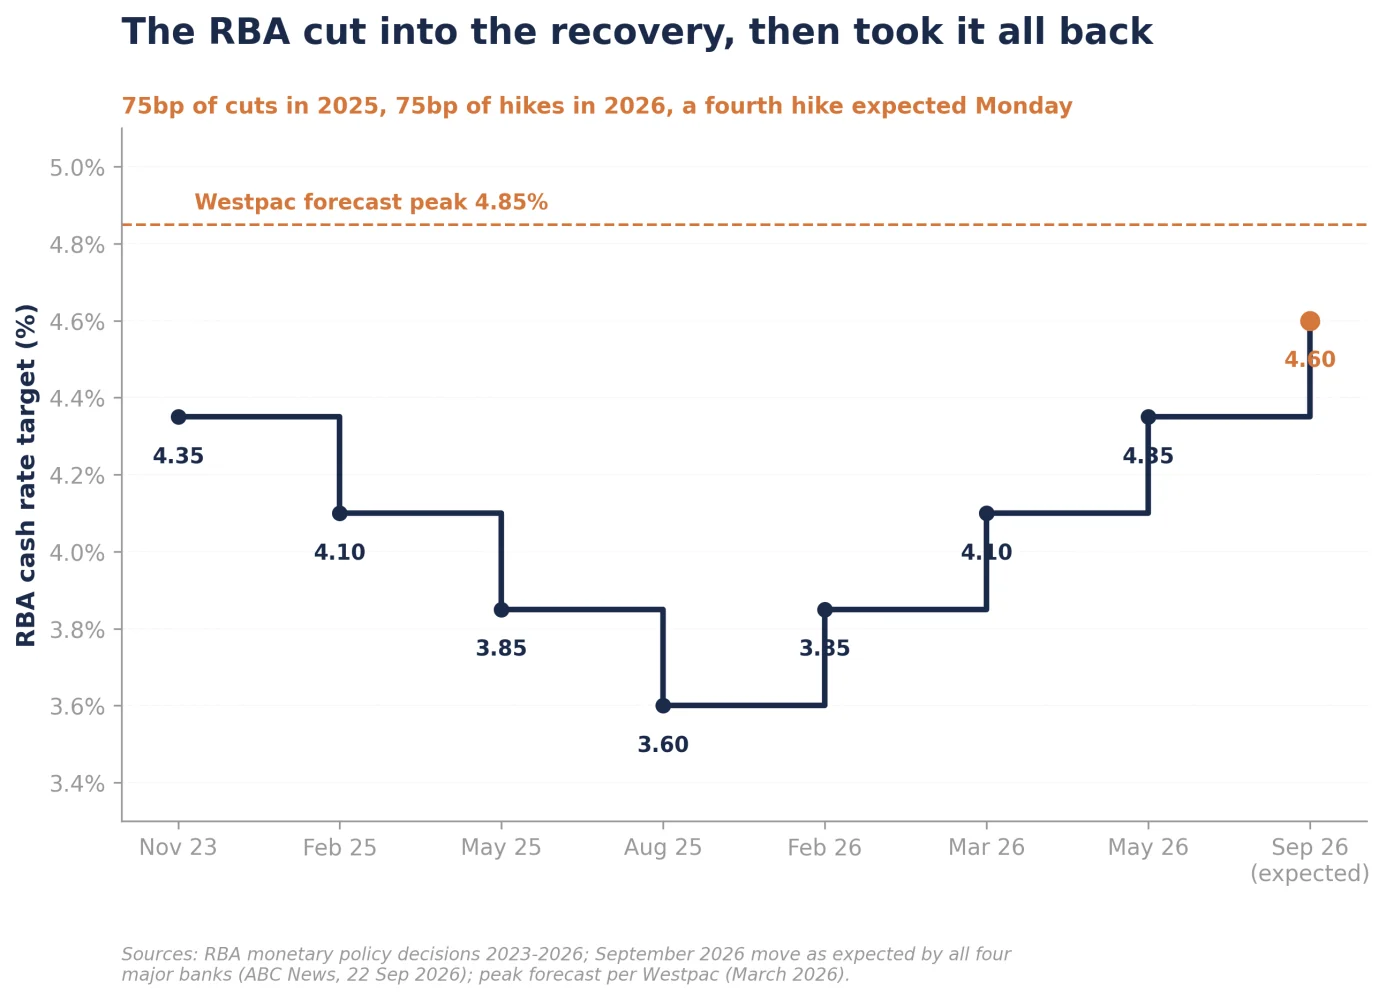
Australian real estate is living through a genuinely unusual configuration: the central bank is tightening into a rental recovery. The RBA has raised the cash rate three times this year, from 3.60% back to 4.35%, and a fourth hike to 4.60% on Tuesday is now expected by all four major banks after Governor Bullock said this week that the upside inflation risks flagged in August are now materialising (RBA; ABC News, 22 September 2026). The 10-year bond has risen 103bp in a year to 5.30%, its highest level in 15 years (Trading Economics, 22 September 2026; ABC News, 1 September 2026). And at exactly the same time, Australian CBD prime effective rents are growing at 7.2% year on year nationally, with Sydney at 10.2% and Brisbane at 11.7% (CBRE, Australia CBD Office Figures Q2 2026; Knight Frank, Australian Office Indicators Q1 2026).
So the numerator and the discount rate are rising together, and every investor in the market is quietly running the same race: can the income grow faster than the capitalisation of that income gets punished? Having underwritten deals through this exact tension all year, I can tell you the answer is not one answer. The hiking cycle is splitting the market into winners and losers along lines that have very little to do with the usual sector labels, and this piece works the maths of where the line actually falls.
The short version: this cycle punishes anyone who bought spread, and pays anyone who owns growth. The rest is arithmetic.
The Market Snapshot: What the Brokers Are Saying
Start with the rate picture, because its shape matters. This is not a straight line up; it is a round trip. The RBA cut three times through 2025, from 4.35% down to 3.60%, as inflation appeared to be settling. Then the global energy shock reignited it: headline inflation was back at 3.5% in July with the trimmed mean at 3.6%, both above the 2-3% target band, and the RBA reversed course with 25bp hikes in February, March and May 2026 (RBA monetary policy decisions; Finder RBA tracker, September 2026). Westpac forecasts the peak at 4.85% (Westpac IQ, March 2026). Bullock's final speech before next weeks meeting emphasised a jobs market that is "probably still a bit too tight", with unemployment of 4.5% to 5% likely needed to take the heat out of wages (ABC News, 22 September 2026).
Now put the property market against it. Knight Frank has prime office yields running from 5.70% in the Sydney CBD out to 8.13% in St Leonards (Knight Frank, Australian Office Indicators Q1 2026). CBRE reports national super prime industrial yields broadly stable in Q2, with Brisbane prime at a 5.50% to 6.00% range (CBRE, Australia Industrial and Logistics Figures Q2 2026). JLL has Melbourne retail yields from 5.50% for neighbourhood centres to 6.25% for large format (JLL, Melbourne Retail Market Dynamics Q2 2026), and Colliers notes retail yields holding "as capital assesses recent macroeconomic shifts, namely higher interest rates" (Colliers, Australian Retail Snapshot Q2 2026).
If we set those yields against a 5.30% bond the spread at the prime end of the market has essentially vanished. Neighbourhood retail offers about 20bp over the risk-free rate. Sydney CBD prime office offers about 40bp. Prime industrial offers about 45bp. Meanwhile the unloved end of the market, metro office, still offers 220bp to 280bp. Property yields have barely moved all year while the bond rose relentlessly, which means the compression has happened silently, inside the spread.
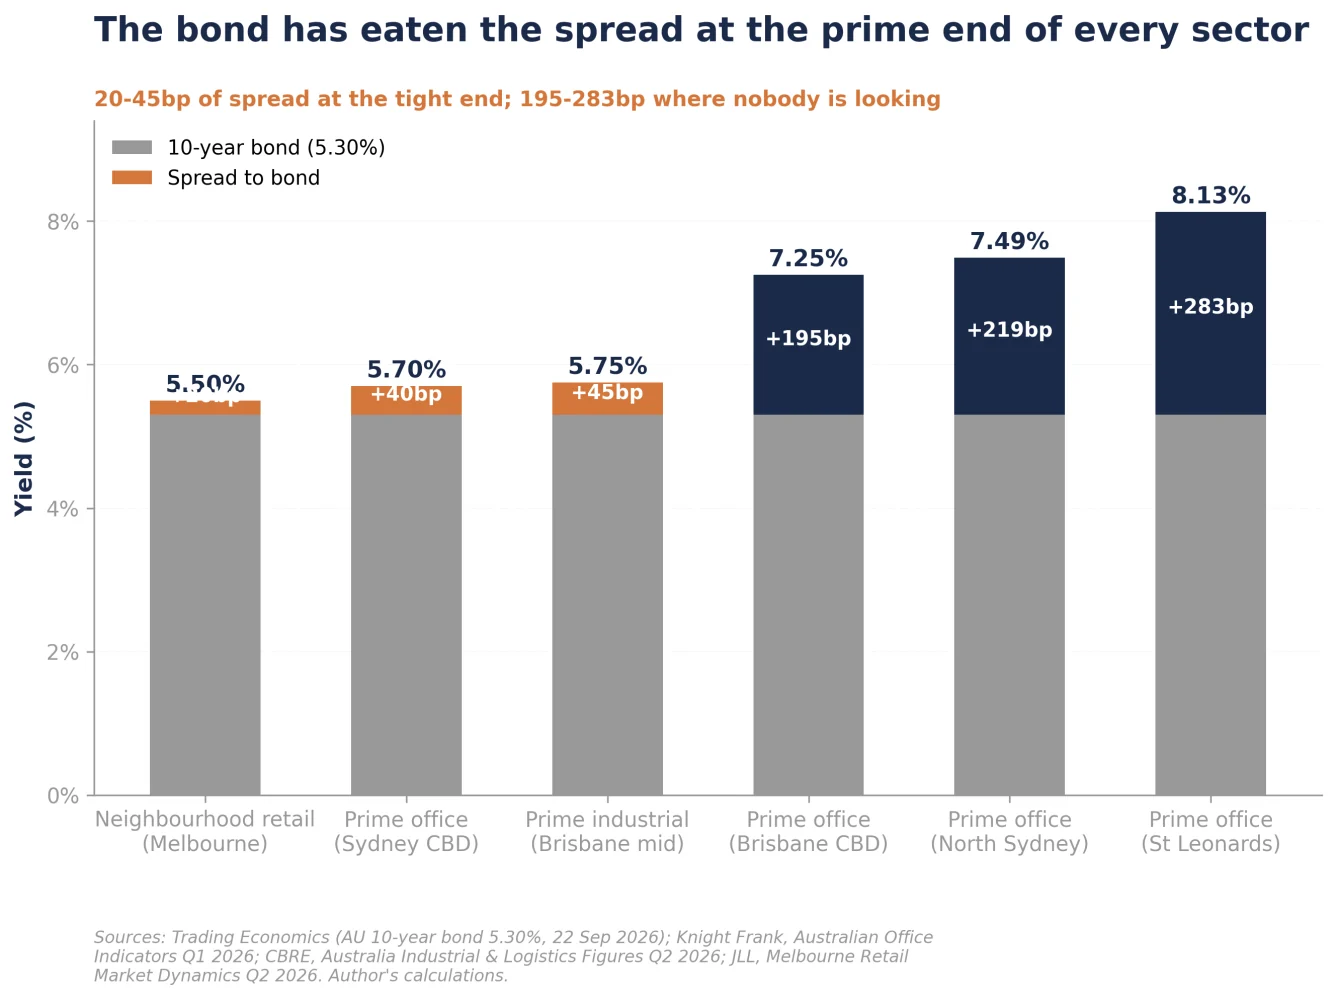
A 20bp to 45bp spread says the market is pricing prime real estate almost as a government bond with better carpet. That is only rational under one assumption: that the income is going to grow, quickly. Which brings us to the maths.
View 1: Rent Growth Is Doing the Heavy Lifting, and You Can Measure Exactly How Much
The reason values have held while bonds sold off is not sentiment; it is arithmetic, and it is worth doing precisely. Value equals income divided by yield. If income rises 10% and the yield is unchanged, value rises 10%. But run it the other way: if income rises 10%, the yield can soften by 10% of itself before the value falls a dollar (very simplified). At a 5.70% Sydney CBD yield, one year of 10.2% effective rent growth absorbs about ~60bp of cap-rate expansion at flat value. Brisbane's 11.7% buys ~70bp. Even the national CBD average of 7.2% buys about ~40bp (my simple calcs; growth rates per CBRE Q2 2026 and Knight Frank Q1 2026).
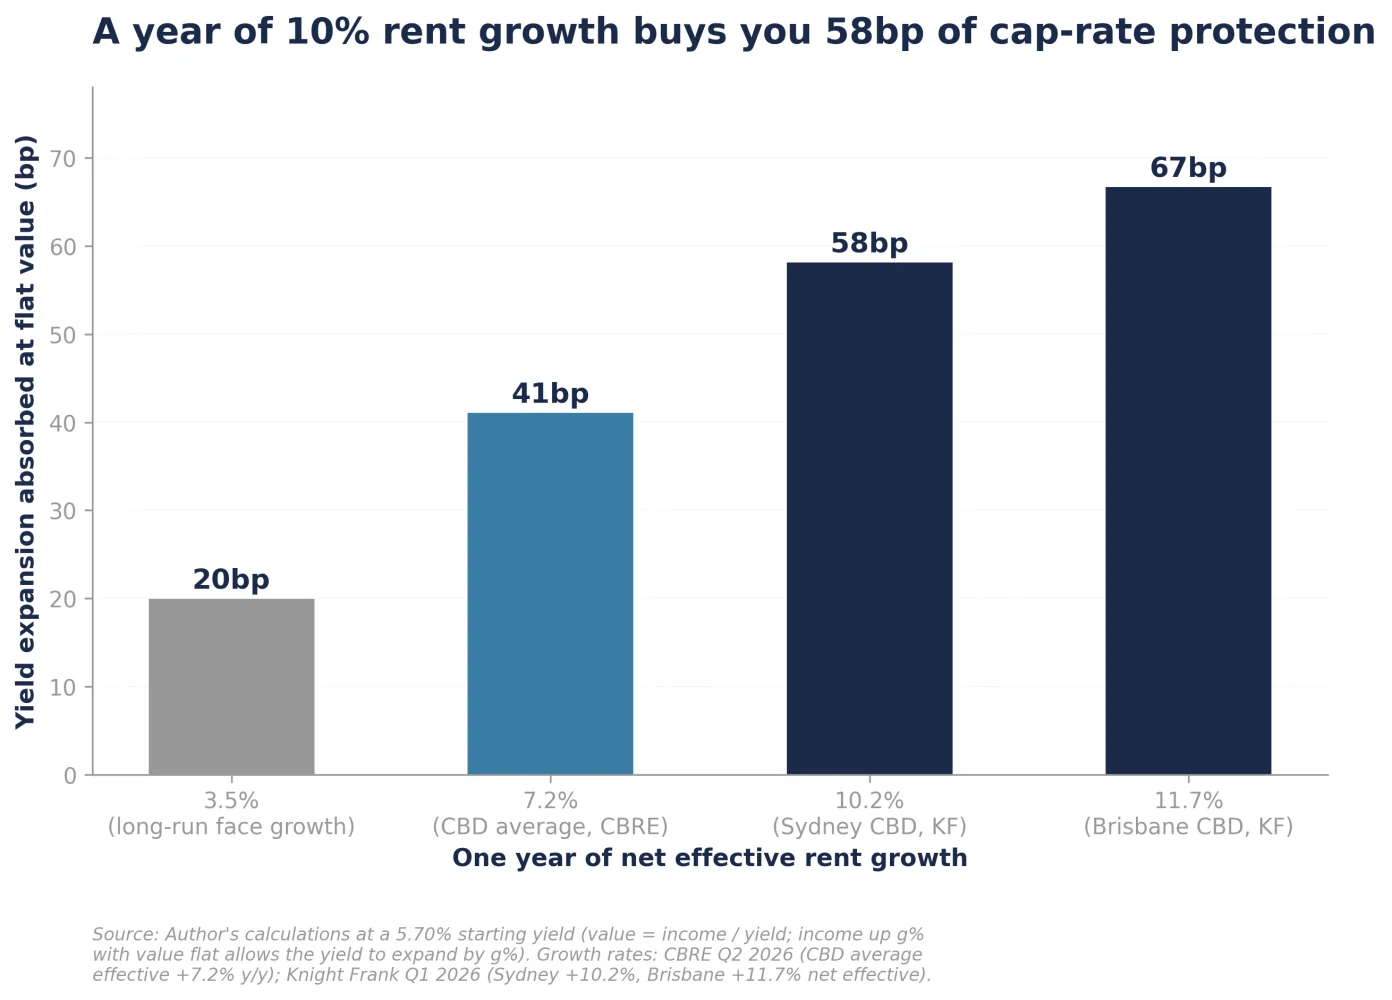
That is the entire story of 2026 valuations in one number: the bond rose about 100bp over the year, prime yields moved barely at all, and one to two years of double-digit effective rent growth is what filled the gap. History says this configuration can persist for years. From 2004 through 2007, US office cap rates fell significantly while interest rates held roughly steady, the entire adjustment absorbed silently inside the spread (Federal Reserve Bank of San Francisco, Cap Rates and Commercial Property Prices, 2011). The same analysis carries the warning label, though: it attributes that compression to expectations of future price appreciation rather than to income, and 2008 marked those expectations to market. The version of the trade that survives is the one funded by rent growth that actually arrives, not by the assumption that someone will pay more later.
But the same arithmetic sets the test that each asset must now pass, and it is brutal in its simplicity: your rent growth has to keep showing up, every year, at or above the pace the bond demands. Two cautions from inside the numbers. First, as the last two editions of this newsletter argued, effective rent growth at these rates is mostly incentive compression, and incentives cannot compress forever; Sydney CBD incentives at 35.5% have a long runway, but the mechanism eventually hands over to face rents, which grow far more slowly (Knight Frank, Australian Office Indicators Q1 2026). Second, the absorption maths is proportional to the starting yield: a year of 10% growth protects a 5.70% asset by ~60bp but protects an 8.13% metro asset by ~80bp. Deep-yield assets get more protection per unit of growth, on top of a spread that is five times wider. The market is paying up for the assets that need the growth most and have the least buffer if it pauses.
View 2: Debt Is Now Dilutive Across the Prime End of the Market
The second consequence of the hiking cycle gets less attention because understandably nobody likes to advertise it: at current rates, borrowing subtracts return from most prime real estate. With 3-month BBSW around 4.50% and standard institutional margins, all-in debt sits near ~6.25% (ASX BBSW). Every asset yielding less than that carries negative leverage: each borrowed dollar earns less in yield than it costs in interest. On the Figure 2 set, that is neighbourhood retail at 5.50%, Sydney CBD office at 5.70% and prime industrial at 5.75%, all underwater on carry by 50bp to 75bp, while Brisbane CBD, North Sydney and St Leonards still cover debt comfortably.
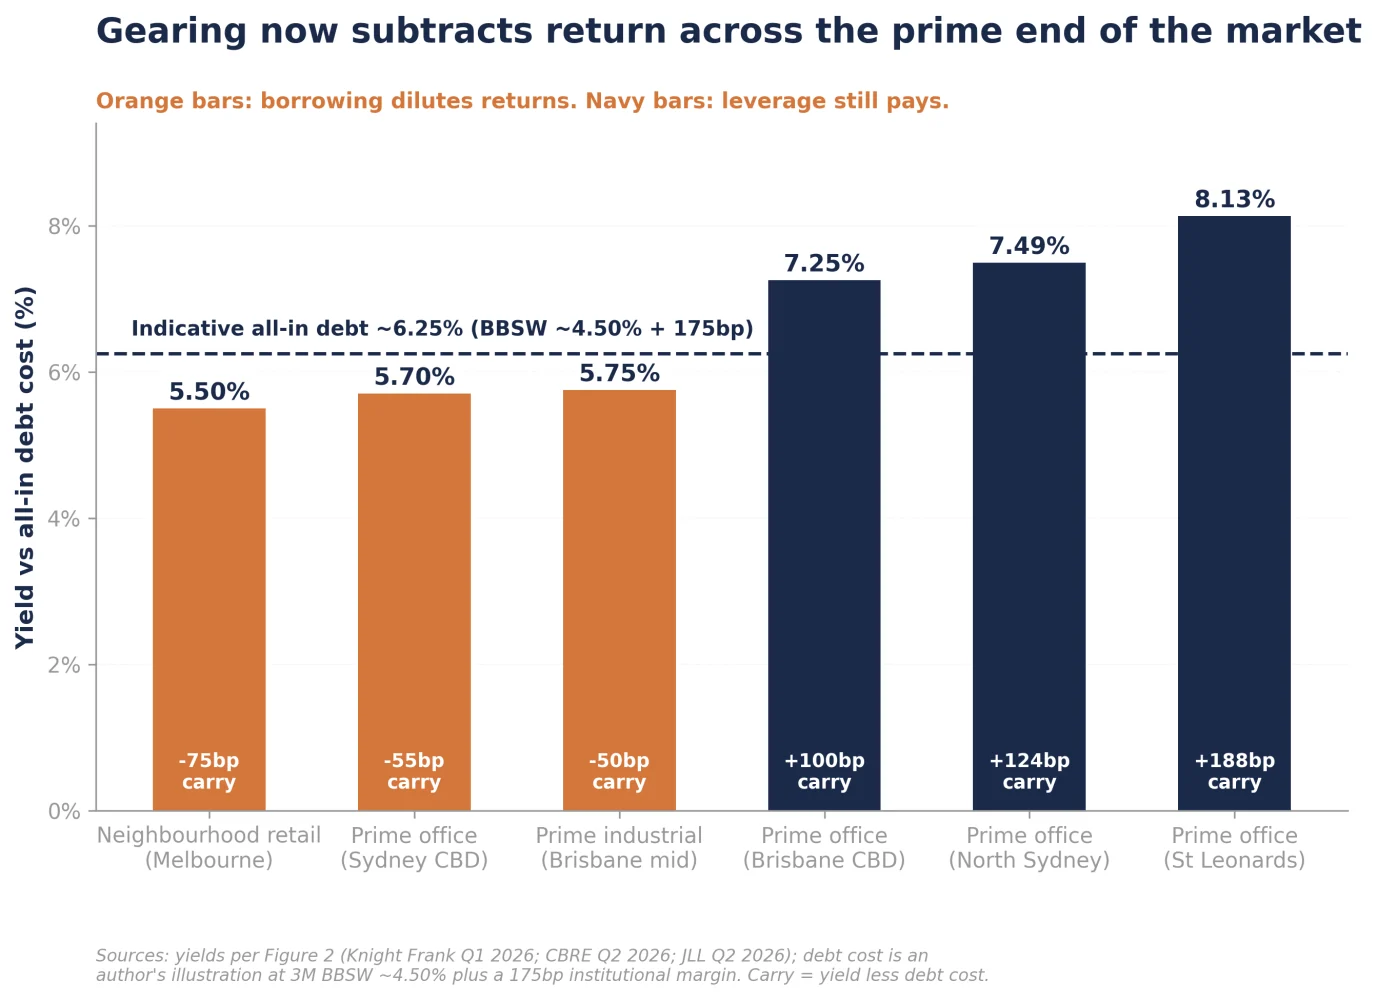
Negative carry does not make an asset unbuyable; it makes the buyer set specific. A geared syndicate cannot make the numbers work at a 40bp bond spread with debt 55bp above the yield, so the marginal buyer of prime Australian real estate is now unlevered or lightly levered equity: super funds, sovereign capital and offshore pensions running growth theses rather than spread theses. Readers of last week's edition will recognise this buyer set; it is exactly the capital that has dominated the A-REIT take-privates since 2021, and it bought National Storage at a 26.5% premium with a growth mandate, not a carry trade. When the marginal buyer does not use debt, the cash rate loses some of its grip on pricing, which is a structural reason prime yields have defied the bond for this long. But it also concentrates the market's fate in a small number of very large allocation decisions, and allocation committees can change their minds faster than rent reviews arrive.
For everyone who does use debt, the discipline is the same one the take-private record taught: the deals that still work are the ones where the yield clears the debt cost with room to spare, which today means the unfashionable end of the yield table, bought at entry yields of 7.25% and above, where carry is positive from day one and the growth is a bonus rather than a requirement.
View 3: The RBA Is Quietly Manufacturing the Next Rent Boom
Here is the contrarian piece of the puzzle, and I think it is the most important. Every rate hike does two things to commercial real estate. The first is the one everybody prices: it raises discount rates and pressures values. The second is the one almost nobody prices: it kills the supply pipeline that would otherwise cap the rent growth.
The mechanism runs through feasibility. A new office tower only gets built when market rents exceed economic rents, the rent level needed to justify construction costs and a developer's return. Knight Frank is blunt about where that equation sits: economic rents remain "well above expected market rents, making the construction of new office towers largely unviable" (Knight Frank, Australian Office Indicators Q1 2026). Every additional 25bp raises the developer's finance cost and the exit yield their appraisal must carry, pushing economic rents further out of reach. The construction industry is simultaneously absorbing renewed cost inflation from the energy shock (Knight Frank, Australian Office Indicators Q1 2026). The result is already in the forward numbers: major-CBD completions are forecast to average around 160,000 sqm a year over the next five years, more than 60% below the 10-year average, against roughly 400,000 sqm a year delivered since 2023 (Knight Frank, Australian Office Indicators Q1 2026).
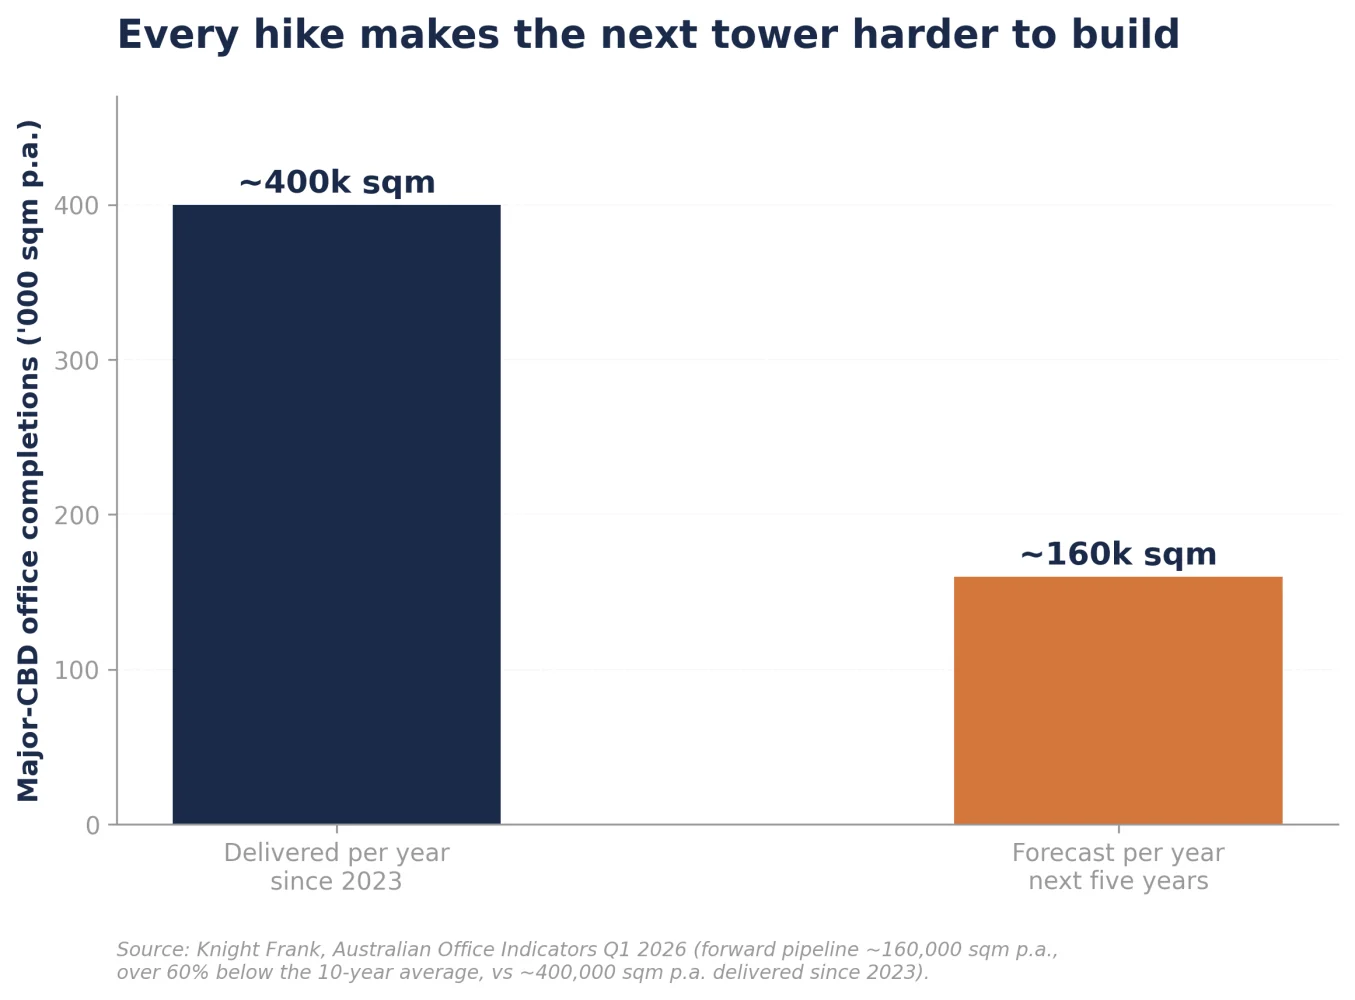
Now close the loop. Demand is positive: 135,279 sqm of national CBD net absorption over the past year, the strongest since early 2022, with five of six CBD markets positive in Q2 (Knight Frank, Australian Office Indicators Q1 2026; JLL, July 2026). Supply is collapsing, and each hike collapses it further. Tenants are competing for existing buildings because new ones cannot be built at current rents. That is a machine for rent growth with a two-to-three-year fuse, and the RBA is winding it tighter at every meeting. The hikes that threaten this year's valuations are simultaneously underwriting the rent growth of 2028 and 2029. Monday's decision, whichever way it goes, feeds the same machine.
This is why "hiking into a recovery" is not the contradiction it sounds like. The rate cycle and the rent cycle are not fighting; the rate cycle is feeding the rent cycle, with a lag. The investors who get hurt are the ones positioned for the wrong half of that sequence: maximum sensitivity to this year's discount rate, minimum exposure to the back-end rent growth.
Where This Goes From Here
Pull the three views together and the playbook writes itself, and it is the opposite of the classic rate-cycle defensive crouch. The assets in genuine danger are the ones the market still calls safe: prime, tightly priced, bought on 20bp to 45bp of bond spread, negative carry if geared, where one pause in rent growth leaves nothing holding the price up but an allocation committee's patience. The assets with the buffer are the ones carrying 200bp to 280bp of spread, positive debt carry, and leverage to the supply drought the hikes are creating; they need far less to go right, and they pay you while you wait.
My view: cautiously constructive over the medium term, with one hard rule: own growth, not spread. Buy income that can outrun the bond, at yields that clear your debt cost, in markets where the supply pipeline has been strangled. Be very suspicious of anything whose investment case begins with the word "core" and ends with a spread you can count on your fingers. The 2025 cuts rewarded everyone indiscriminately; the 2026 hikes are a sorting machine. Monday afternoon the RBA will most likely add another 25bp to the sorting pressure. The maths in this piece holds either way: the question was never whether rates rise, it is whether your rents rise faster.
Sources
- Reserve Bank of Australia, monetary policy decisions 2025-2026 (cuts February/May/August 2025 to 3.60%; hikes February/March/May 2026 to 4.35%), https://www.rba.gov.au/monetary-policy/int-rate-decisions/2026/
- ABC News, Rates set to rise as RBA governor says 'heat' needs to be taken out of job market, 22 September 2026 (Bullock speech; hike to 4.60% expected by all four major banks), https://www.abc.net.au/news/2026-09-22/rba-governor-michele-bullock-interest-rate-increase-predictions/107181326
- Westpac IQ, Revised RBA rates view: two extra hikes, 4.85% peak, 30 March 2026, https://www.westpaciq.com.au/economics/2026/03/rba-update-30-march-2026
- Trading Economics, Australia 10-year government bond yield (5.30% on 22 September 2026, up 103bp year on year), https://tradingeconomics.com/australia/government-bond-yield
- ABC News, Australian government 10-year bond hits 15-year high, 1 September 2026, https://www.abc.net.au/news/2026-09-01/australian-government-10-year-bond-hits-15-year-high/107103096
- Finder, RBA cash rate tracker (July 2026 inflation 3.5% headline, 3.6% trimmed mean; 2025-2026 rate path), https://www.finder.com.au/rba-cash-rate
- CBRE, Australia CBD Office Figures Q2 2026 (prime effective rents +1.8% q/q, +7.2% y/y), https://www.cbre.com.au/insights/figures/australia-cbd-office-figures-q2-2026
- Knight Frank, Australian Office Indicators Q1 2026 (yields by market; net effective rent growth Sydney +10.2%, Brisbane +11.7%; Sydney incentives 35.5%; supply pipeline ~160,000 sqm p.a., >60% below the 10-year average, vs ~400,000 sqm p.a. since 2023; economic rents above market rents; net absorption 135,279 sqm), https://content.knightfrank.com/research/2910/documents/en/australian-office-indicators-q1-2026-12815.pdf
- CBRE, Australia Industrial and Logistics Figures Q2 2026 (super prime yields stable; Brisbane prime 5.50-6.00%), https://www.cbre.com.au/insights/figures/australia-industrial-and-logistics-figures-q2-2026
- JLL, Melbourne Retail Market Dynamics Q2 2026 (weighted average yields 5.50% neighbourhood to 6.25% large format), https://www.jll.com/en-au/insights/market-dynamics/melbourne-retail
- Colliers, Australian Retail Snapshot Q2 2026 (yields broadly unchanged as capital assesses higher rates), https://www.colliers.com.au/-/media/files/anz/australia/research/2026/quarterly-snapshots/q2/q22026_-retail_snapshot_australia.ashx?sc_lang=en-au
- JLL, Australian office markets showed resilience through Q2, 9 July 2026 (five of six CBD markets positive net absorption), https://www.jll.com/en-au/newsroom/australian-office-markets-showed-resilience-through-q2
- Federal Reserve Bank of San Francisco, Cap Rates and Commercial Property Prices, September 2011 ("from 2004 through 2007... interest rates were roughly steady while cap rates fell significantly"; compression attributed to price appreciation expectations), https://frbsf.org/economic-research/publications/economic-letter/2011/september/cap-rates-commercial-property-prices
- Author's calculations (spreads to bond; rent-growth absorption maths; debt carry at an illustrative 6.25% all-in cost of BBSW ~4.50% plus 175bp). Full workings in generate_charts.py in this folder.