for institutional deal workflows


Two editions of this newsletter have leaned on one concept: face rents are the market's press release, incentives are its confession. This edition measures the confession. Having assessed leasing assumptions in both an investment and advisory capacity, I can report that the incentive is simultaneously the most decision-critical number in Australian real estate and the most inconsistently quoted: two brokers publish 34.9% and 42.6% for the same market in the same quarter, and both are correct (Knight Frank, Australian Office Indicators Q2 2026; JLL via the V2 basis reconciliation). Most market participants never reconcile the two. This piece does, for every submarket at once.
The timing of this post is deliberate. Knight Frank's September Melbourne report called the top: prime incentives at 48.1%, "approaching their peak", expected to stabilise through 2027 and then decline as the supply pipeline empties (Knight Frank, Melbourne CBD Office Market Report, September 2026). If that call is right, the single most profitable thing an investor can do this quarter is know exactly where incentives sit, on one consistent basis, before the compression starts. That is what the map below is for.
Everything here runs on a dataset we built for our own underwriting: the Q2 2026 broker layer across 61 submarkets, every FY26 leasing outcome disclosed by the 33 listed REITs, and the valuation inputs their valuers signed off at 30 June (CrossCourtAI Leasing Comps V2; independently audited extraction).
The Market Snapshot: What the Brokers Are Saying
Start with the span, because almost nobody holds it in their head at once. At one end, BWP Trust paid incentives of 0.6% across its Bunnings-anchored portfolio in FY26, and HomeCo Daily Needs paid 4.9% (BWP and HDN FY26 disclosures via Leasing Comps V2). At the other, Knight Frank's current transacting range for Melbourne CBD office runs to 55% net (Knight Frank, Melbourne CBD Office SOTM Q2 2026). Between them: industrial precincts from 7.5% (Adelaide Outer South) to 26.1% (Melbourne West), retail new-lease averages from 10% (Sydney large format, the lowest of any commercial class) to 27% gross (Melbourne CBD retail), and office submarkets from 36% to 54% net-equivalent (Knight Frank Q2 2026; Colliers, Australian Retail Snapshot Q1 2026; all via Leasing Comps V2).
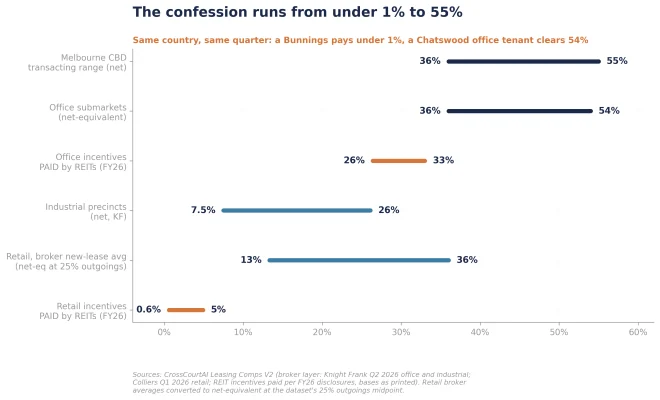
The span is the first lesson: "the incentive environment" is not one environment. A Bunnings lease and a Docklands office floor are not the same product with different discounts; they are different financial instruments. The incentive level is the market pricing, in one number, the scarcity of the tenant relative to the space: sub-1% where the tenant is the covenant the asset is built around, 50%+ where landlords compete for scarce tenants in oversupplied towers.
And the headline numbers you read are often not even on the same basis, which is where the masterclass begins.
View 1: One Number, Four Meanings
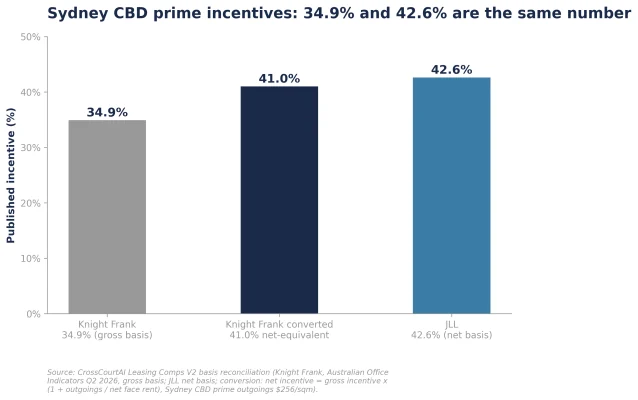
An incentive is a percentage, and a percentage needs a denominator. The industry uses two: gross rent (rent plus outgoings) and net rent. Knight Frank quotes Sydney, Brisbane, Adelaide and Canberra office incentives on gross; Melbourne, Perth and Parramatta on net; JLL quotes net; Colliers quotes retail on gross (Leasing Comps V2 basis flags). The same economic deal therefore prints different numbers in different reports, and the conversion is not cosmetic: net incentive = gross incentive × (1 + outgoings ÷ net face rent). On Sydney CBD prime, with outgoings of $256/sqm against a $1,470 net face, Knight Frank's 34.9% gross is 41.0% net-equivalent, which is why JLL's separately surveyed 42.6% net is the same market reading, not a disagreement (Leasing Comps V2 reconciliation).
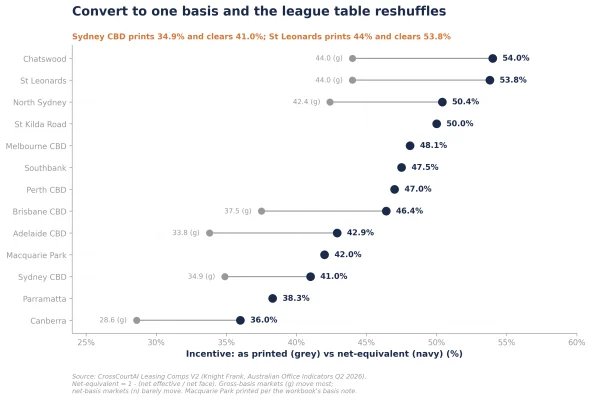
Run that conversion across all thirteen office submarkets and the league table reshuffles. Sydney CBD prints 34.9% and clears 41.0%. St Leonards prints 44% and clears 53.8%. Parramatta prints 38.4%, but that is already net, so it stays put, and suddenly sits below Sydney CBD rather than above it. Anyone comparing raw printed incentives across markets, which is to say almost everyone, is mis-ranking markets by up to ten percentage points (Figure 3; Knight Frank Q2 2026 via Leasing Comps V2).
The second axis is new versus renewal versus blended, and the third is structure. The cleanest demonstration in the dataset comes from a single Brisbane building: 123 Albert Street signed two deals in the same quarter at near-identical face rents, one at a 16% incentive plus a fitout contribution, one at 35% to 40% straight (Knight Frank Brisbane CBD evidence via Leasing Comps V2). Same building, same quarter, same headline rent, utterly different landlord cash flow. The percentage is shorthand for a financing negotiation: who funds the fitout, over what term it amortises, and what happens to it if the tenant leaves. Which is why the only safe discipline is the one this dataset enforces: never compare two incentive numbers until you have checked the basis flag on both.
View 2: The Incentive Map
Here are all 61 submarkets on one basis: office at net-equivalent, industrial as printed (Knight Frank quotes industrial net in every city, the one mercy in this vocabulary), and retail converted from its gross printing at the dataset's 25% outgoings midpoint (Leasing Comps V2).
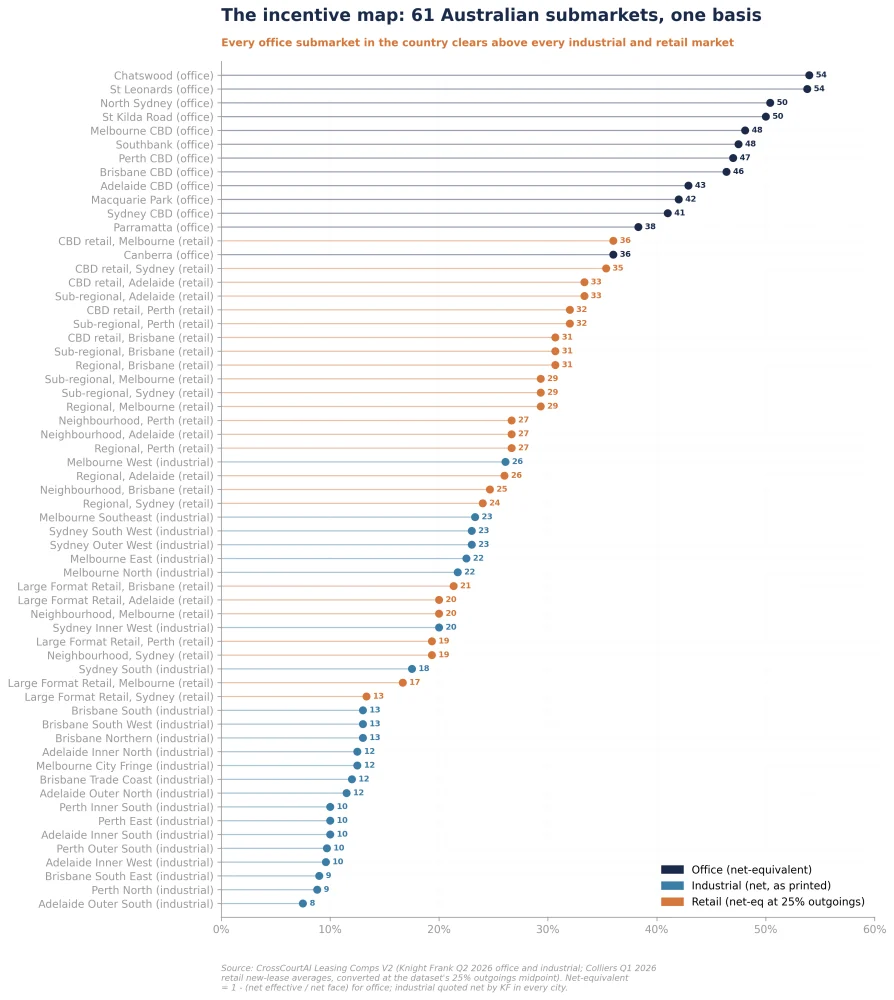
Three structural readings. First, the sectors barely overlap: every office submarket in the country clears above every industrial precinct and every suburban retail market. Office medians sit at 47% net-equivalent, retail at 27%, industrial at 12.5% (author's calculations from the V2 layer).
Second, within office, the map is a supply map. The 36% floor is Canberra; the 50%+ tier is St Kilda Road, Chatswood, St Leonards, North Sydney and Melbourne's Docklands-to-Flagstaff arc, precisely the submarkets with the deepest vacancy. Incentives are doing what prices do: clearing markets that face rents refuse to clear. Melbourne's precinct detail makes the point inside one CBD: Eastern Core at 39.7% net against Flagstaff at 55%, a sixteen-point spread within two kilometres (Knight Frank, Melbourne CBD Office SOTM Q2 2026).
Third, industrial's quiet divergence is the sleeper. Sydney's precincts run 17.5% to 23% while Adelaide and Perth sit at 7.5% to 12.5%, and Melbourne's West has crept to 26.1%, with Knight Frank noting select-suburb evidence at 30% to 32.5% (Knight Frank Q2 2026). Melbourne industrial's face-rent growth story, +9.4% year on year in the Southeast, has been largely handed back through incentives, which rose from 16.9% to 23.3% over the same year. An underwrite that keys the national industrial "feel" of around 15% is four to eleven points light in Melbourne, on a sector where everyone's model carries the same cheerful reversion assumptions (Leasing Comps V2).
View 3: What Valuers Key, What Landlords Paid, What the Market Charges
The confession has three volumes, and they do not say the same thing. Volume one is what valuers key into the fair-value models behind every book value. Here the dataset's most striking finding is an absence: across 922 valuer-input rows extracted from the FY26 accounts of all 33 listed REITs, exactly one REIT, GPT, discloses the incentive assumption its valuers use: a 25.7% midpoint for office, 18.75% for industrial, 6.75% for retail (GPT FY26 financial report via Leasing Comps V2). The single most price-sensitive leasing input in an office valuation is, with one exception, invisible in the accounts it drives.
Volume two is what landlords actually paid. Office REITs disclosed average incentives of 26.4% to 33% in FY26, median 30.7%, with new leases at 27% to 35% and renewals at 25% to 32%; industrial REITs paid a median 17.5%; BWP paid 0.6% (REIT FY26 disclosures via Leasing Comps V2, bases as printed by each REIT).
Volume three is what the broker market charges today: medians of 47% net-equivalent for office, 12.5% for industrial (author's calculations from Figures 3 and 4).
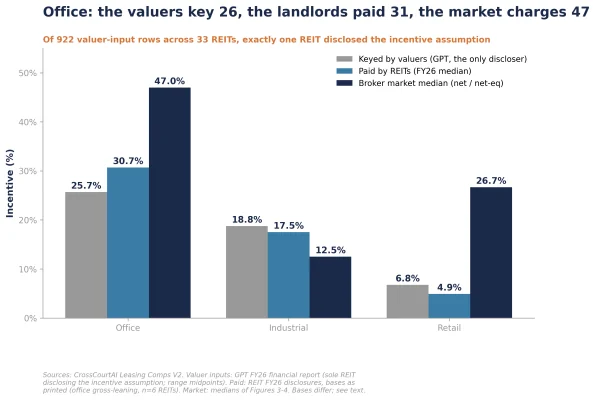
Read the office column left to right: keyed 26, paid 31, market 47. The three numbers are not contradictory, and this is the nuance that keeps the comparison honest. Valuers key a through-cycle assumption across a whole portfolio, including sitting tenants who never transact; landlords' paid averages blend renewals, which clear cheaper, with new deals; the broker number is the marginal price of a new tenant in a competitive submarket today. Each is right for its own purpose. The trap is using them interchangeably: underwrite a vacant floor at the keyed 26% when the marginal market price is 47%, and your letting-up assumption is off by more than a third before the model runs. The industrial column inverts, paid 17.5% against a 12.5% market median, for a structural reason: REIT industrial portfolios concentrate in Sydney and Melbourne, where precinct incentives run 17.5% to 26%, while the national median is dragged down by single-digit Adelaide and Perth (Leasing Comps V2). Even the inversions are basis effects.
For a buyer, this three-volume structure is the edge. The valuer's number tells you what is in the book; the paid number tells you what a stabilised portfolio achieves; the market number tells you what your vacancy will actually cost to fill. Deals are won by the bidder who prices the third number while competitors anchor on the first.
Where This Goes From Here
The map was measured at what Knight Frank now calls the peak: Melbourne prime incentives at 48.1%, expected to stabilise through 2027 and then fall, with net effective rents forecast to grow 5.3% a year to 2031 (Knight Frank, September 2026). The arithmetic of that call is the reason to care about every number above. At a flat $773 net face, Melbourne's net effective rent at a 48.1% incentive is $401, exactly what Knight Frank publishes. Compress the incentive to 40% and the effective rent is $464, a 16% rise with zero face growth. At 35%, $502 and a 25% rise (author's calculations; Knight Frank Q2 2026 inputs). This is the same one-way machine the yield editions described from the other side: recoveries arrive through the incentive line first, invisibly to anyone watching face rents, and violently for anyone owning the effective cash flow.
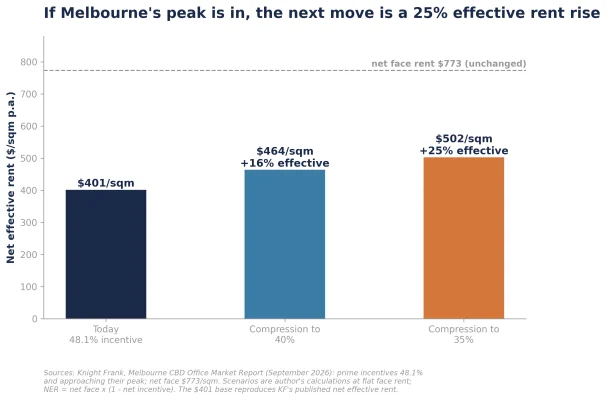
My view: measure it at the peak, and underwrite the real number. The incentive is where this market's truth lives, and the discipline is mechanical rather than clever: check the basis flag before comparing anything to anything; price vacancy at the marginal market incentive, not the keyed or blended one; treat the structure of the deal, who funds the fitout and how it amortises, as part of the price; and in the submarkets where the incentive peaked at 50-plus, recognise that the most leveraged exposure to the recovery is not the face-rent headline, it is the quiet, compounding closure of the gap between $401 and $502. Face rents will take years to say what incentives are about to admit in quarters.
Sources
- CrossCourtAI Leasing Comps V2 (compiled 10 October 2026): broker layer from Knight Frank Q2 2026 state-of-the-market reports (office and industrial, all capital cities; basis flags per market) and Colliers Australian Retail Snapshot Q1 2026; REIT layers from the FY26 disclosures of all 33 ASX/NZX REITs (leasing outcomes, incentives paid, 922 AASB 13 valuer-input rows); independently audited extraction (53-row random sample: zero errors). Workbook AU_Leasing_Comps_Submarket_2026_V2.xlsx; charts generated live from it in generate_charts.py, this folder.
- Knight Frank, Australian Office Indicators Q2 2026 (office submarket face rents, incentives and bases; Sydney CBD prime 34.9% gross; St Leonards 44% gross; net-equivalent conversions per the V2 reconciliation).
- Knight Frank, Sydney CBD Office State of the Market Q2 2026 (precinct detail; Southern precinct at a record 46% net-face discount to Core).
- Knight Frank, Melbourne CBD Office State of the Market Q2 2026 (precinct incentives 39.7% to 55% net; transacting range 36%-55%).
- Knight Frank, Melbourne CBD Office Market Report, September 2026 (prime incentives 48.1%, approaching their peak, stabilising through 2027; net effective rents forecast +5.3% p.a. to 2031), via Commo, https://www.commo.com.au/news/2026/09/23/melbourne-cbd-office-market-shows-positive-signs-%E2%80%93-knight-frank/1790135693
- Knight Frank, Melbourne / Brisbane / Adelaide / Perth Industrial State of the Market reports, Q2 2026 (Perth Q1 2026): precinct net incentives; Melbourne West select-suburb evidence at 30.0%-32.5%.
- Colliers, Australian Retail Snapshot Q1 2026 (retail new-lease average incentives by centre type and city, gross basis; large format Sydney 10%, the lowest of any class).
- GPT Group, FY26 financial report (the sole REIT disclosing valuer incentive assumptions: office 13.9%-37.5%, midpoint 25.7%; industrial 7.5%-30%; retail 4.67%-8.83%), via Leasing Comps V2 (page-cited).
- REIT FY26 disclosures via Leasing Comps V2: office incentives paid 26.4%-33% (ABG, DXS, GOZ, GPT, SGP; new 27%-35%, renewals 25%-32%); industrial median 17.5% (DXS, GOZ, SGP; SGP new 21% / renewal 12%); BWP 0.6%; HDN 4.9%. Bases as printed by each REIT.
- JLL Sydney CBD prime net incentive 42.6% per the V2 basis reconciliation (cross-broker check on Knight Frank's 34.9% gross).