for institutional deal workflows


Three editions ago, this newsletter priced one building four ways: initial yield, core market yield, equivalent yield and IRR. But there is a fifth yield, and it is the strangest of the family. It is the cap rate implied by a REIT's share price: take the market's valuation of the equity, add back the debt, and ask what yield the portfolio would be trading at if the share market were right. It is simple but revealing.
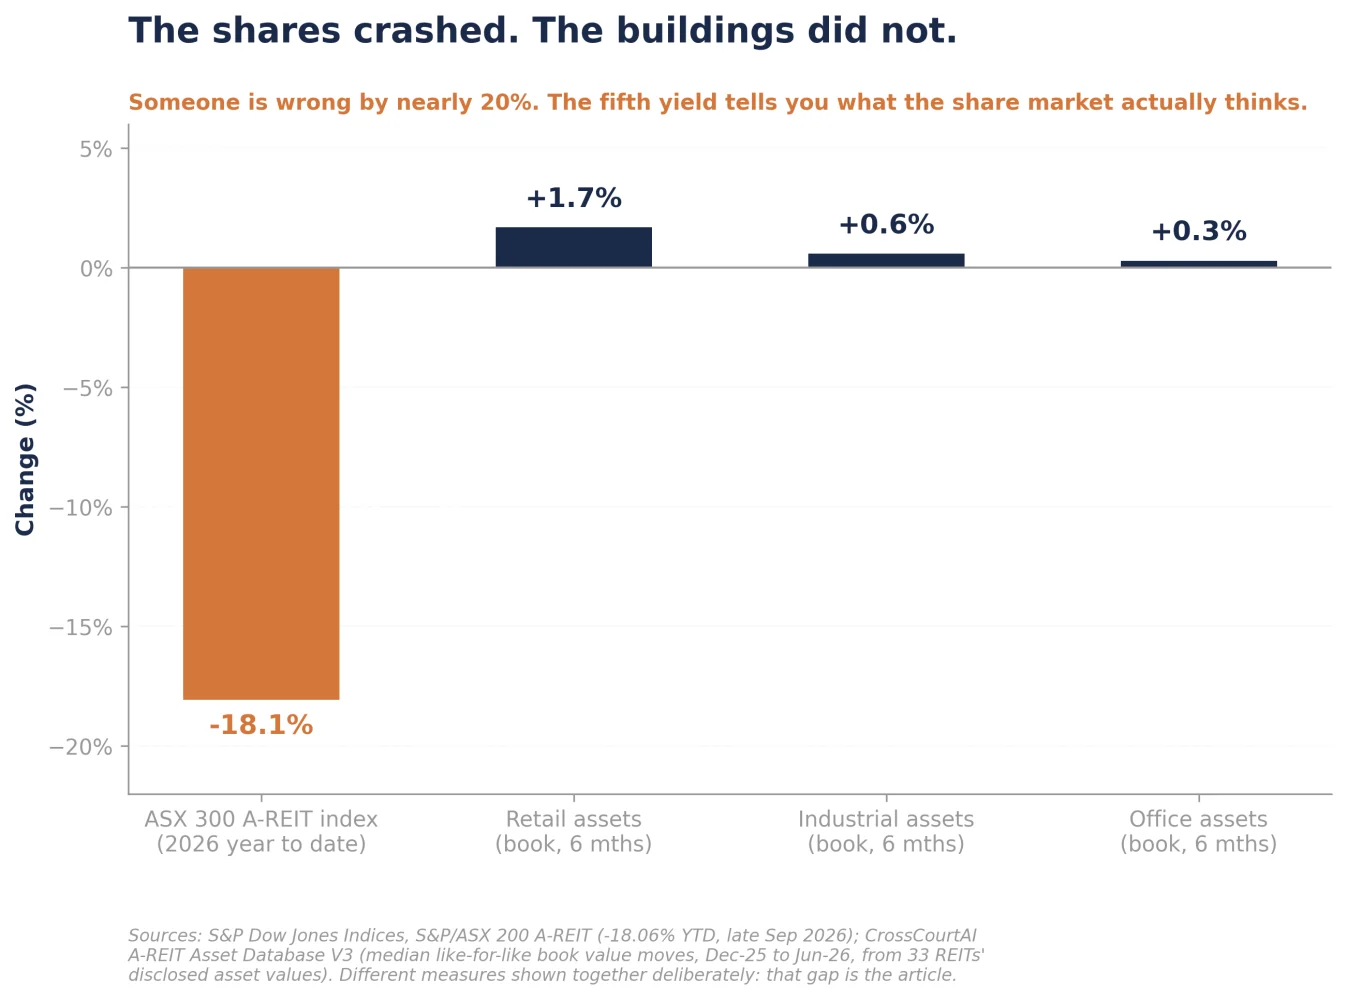
The S&P/ASX 200 A-REIT index is down 18.1% in 2026 (S&P Dow Jones Indices, late September 2026) while the buildings underneath barely moved: across the 33 REITs median like-for-like book values rose 1.7% in retail, 0.6% in industrial and 0.3% in office over the six months to June (CrossCourtAI A-REIT Asset Database V3). The same assets now carry two prices nearly 20% apart, and the fifth yield is the instrument that converts that disagreement into a cap rate you can debate with.
This edition computes it properly: the method, verified against the standard; the table, built name by name from audited inputs; and what the answer means, which is not what the discount headlines suggest.
The Market Snapshot: What the Brokers Are Saying
Start with the two prices. On the listed side, 2026 has been brutal: four RBA hikes and a 15-year-high bond have taken the A-REIT index down 18.1% year to date (S&P Dow Jones Indices, late September 2026), and the sector excluding fund-manager REITs trades on a 12.9 times price-earnings multiple with an average 16.8% discount to asset backing (UBS figures via Stockhead, 2 October 2026).
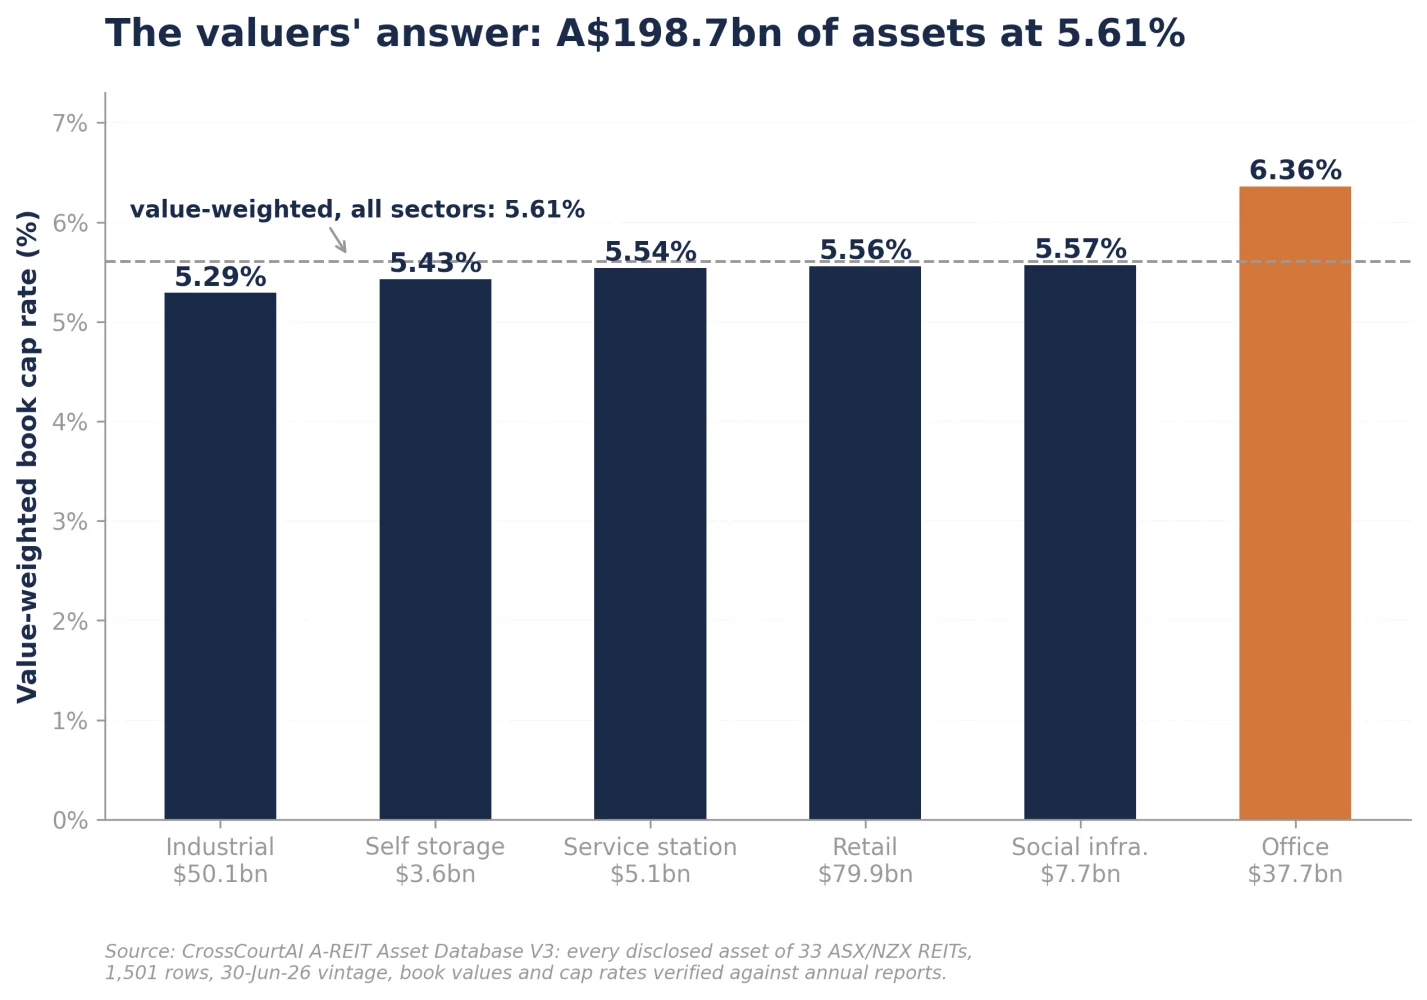
On the direct side, the valuers are serene. Our database holds every disclosed asset of 33 ASX and NZX REITs at 30 June 2026: 1,501 rows, A$198.7bn of book value at share, at a value-weighted cap rate of 5.61%, barely moved from 5.68% in December (CrossCourtAI A-REIT Asset Database V3, verified against annual reports). By sector: industrial 5.29%, retail 5.56%, office 6.36% (Database V3). The brokers see the same calm: Colliers notes yields holding as capital assesses higher rates, and Knight Frank reported prime yields broadly steady through the hiking cycle even as the bond rose 100bp (Colliers, Quarterly Asset Class Snapshots Q2 2026; Knight Frank, Australian Office Indicators Q1 2026).
Two prices for the same assets is not a stable condition. The last time this newsletter examined the gap, through the take-private record, the resolution mechanism was visible: nine whole-register bids in a decade, mostly landing above book, delivered by pension and sovereign capital. The fifth yield is how that capital decides when to move. So let us compute it the way they do.
View 1: The Fifth Yield, Defined Properly
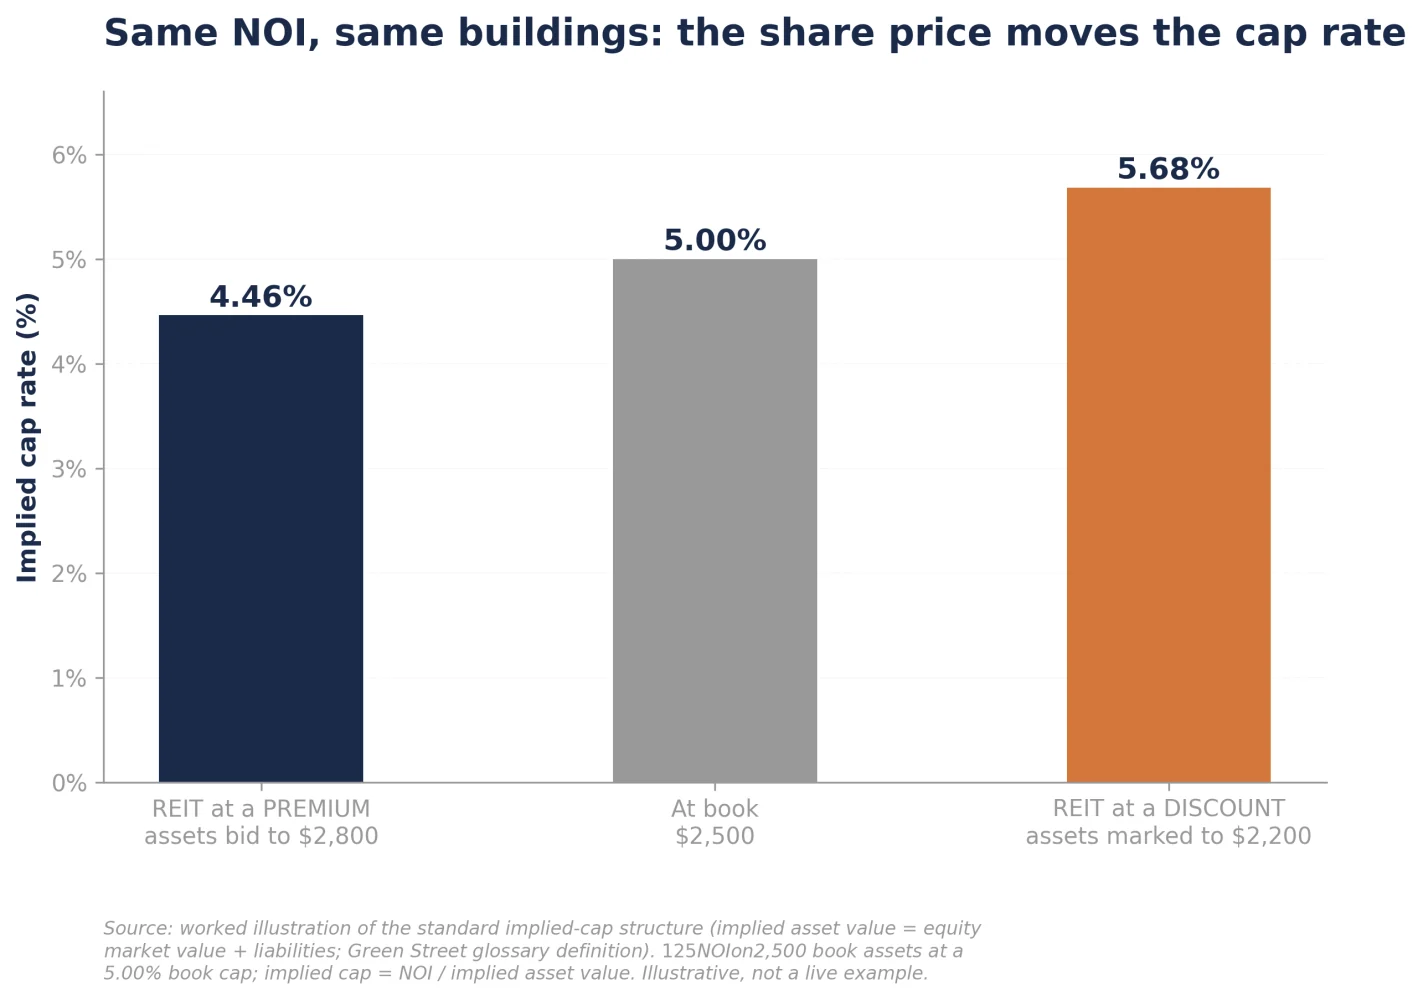
The implied cap rate is a standard institutional metric; Green Street built its REIT research franchise on it, defining it as the cap rate at which net asset value per share equals the current share price (Green Street, glossary definitions). The mechanics: the market prices the equity; add the liabilities back and you have the market's valuation of the assets; divide the portfolio income by that valuation and you have the market's cap rate. Same income, same buildings; only the denominator changes with the share price.
The reason most published versions of this number deserve suspicion is the income line. REITs do not disclose clean property NOI: funds-management fees, development profits and corporate costs are blended through the earnings, and every analyst un-blends them differently (CenterSquare's methodology, for instance, strips non-recurring items and non-income-producing assets; CenterSquare, REIT Cap Rate Perspective). So we rearrange the same identity onto inputs that are all audited. If a REIT trades at discount d to NTA, and its equity funds a share e of the asset base (one minus gearing), then the market is marking the assets down by d times e, and:
Implied cap = book cap ÷ (1 − d × e)
Every input is a statutory number: the book cap from valuations in the accounts, the NTA from the results, gearing from the balance sheet, the discount from the screen. No NOI estimation anywhere. The rearrangement reproduces the standard calculation exactly: run the textbook worked example (a 5.00% book cap on $2,500 of book assets, with the market pricing the assets at $2,800) and both routes give 4.46% (worked illustration of the Green Street structure).
And if you want proof this is the market's own language rather than an analyst's invention, Centuria Office provided it in August: COF's FY26 results presentation prints "Portfolio WACR 7.04%" alongside "Implied cap rate 9.38%", computed at its 30 June unit price of $0.89 (Centuria Office REIT, FY26 Results Presentation, August 2026). Run our rearrangement at that same price and date and it returns 9.5%, within 15 basis points of COF's own number, the small residual being balance-sheet composition. REITs themselves now publish the fifth yield when they believe their price is wrong; the rest of this piece simply computes it for everyone, on one consistent basis.
Three assumptions travel with the formula, and they decide which REITs it can honestly be applied to: debt at book value, no material non-property earnings, and income consistent with the stated book cap. That third one is why this only works on rent collectors. For Goodman, Charter Hall or Stockland, the share price capitalises a funds-management or development business worth billions, so the equity discount or premium says nothing clean about the buildings; computing an "implied cap" for them is a category error, and most of the scary sector-discount headlines you read commit it. The honest mathematics is in the pure-plays.
View 2: The Table; office discount is 2-4x retail / industrial
Figure 4 is the fifth yield for nine pure-play A-REITs, computed at the 12 October close against June 2026 NTAs, gearing and our database's verified book caps, every one of which we re-confirmed against the REITs' own FY26 results documents for this piece: six of the nine portfolio WACRs (COF 7.04%, GDI 6.8%, CIP 5.8%, CLW 5.4%, CQR 5.45%, HDN 5.53%) appear verbatim in company presentations and announcements (sources itemised below; prices Stock Analysis, 12 October 2026).
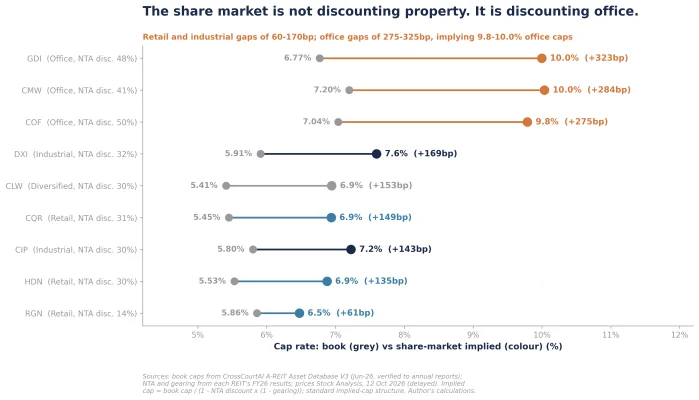
The retail and industrial names cluster at gaps of 60bp to 170bp over book; after an 18% index fall and a 100bp bond move, that is close to the ordinary cost of listed liquidity in a risk-off year, not a verdict on the assets. The office pure-plays are a different animal entirely: 275bp to 325bp over book, implying cap rates of 9.8% to 10.0% against books of 6.8% to 7.2%. The share market is not discounting property; it is discounting office, specifically and savagely, while pricing the rest of the sector at something close to respect. Two caveats belong on the record: GDI and CMW carry small non-rental businesses, so their rows deserve wider error bars than the clean trusts, and all nine implied caps move daily with the screen; these are 12 October numbers, not constants.
Now connect the table to the record. Every completed take-private of the past decade began with a gap like the right-hand column, and the deals cleared at a median 9.2% premium to NTA, far above where these securities trade. National Storage left the board in May at a 26.5% premium to its undisturbed price. The fifth yield at a wide gap is not evidence that the valuations are wrong; it is the price signal that historically summons the capital that closes the argument, one register at a time.
View 3: The Same Trade, Priced in Two Hemispheres
Australia's gap looks different, and more interesting, with the American comparison alongside it. CenterSquare, which has published implied cap rates across roughly 200 US listed real estate companies for years, puts US office REITs at a 7.91% implied cap against a 7.09% private-market cap rate for the same portfolios, a gap of roughly 80 basis points, with all US REITs at 5.71% implied (CenterSquare, The REIT Cap Rate Perspective Q2 2025). Compare Australia: our office pure-plays imply 9.9% against books averaging 7.0%, a gap of roughly 290 basis points (author's calculations). The methods differ enough that the comparison is directional rather than precise, but the shape of the difference is the story.
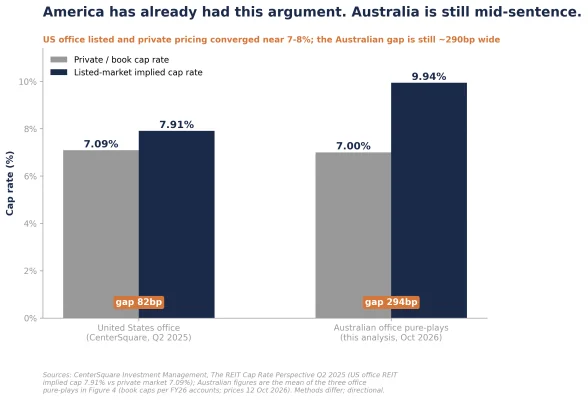
Two things follow. First, America has already finished the office argument that Australia is still having. US listed and private office pricing have converged in the 7% to 8% range; the two sides of that market now broadly agree on what an office building is worth, and the agreement was reached through years of transactions, writedowns where warranted, and recapitalisations. Australia's 290 basis point office gap is the same argument, mid-cycle. Second, where the gap has already closed locally, it closed upward as often as down: both listed markets price the non-office sectors within normal distance of private values, and Australia's recent direct office evidence, CIP's $200m of sales at a 17% premium to book and COF's Chatswood sale at a 12.5% premium (company FY26 results), has so far supported the book side of the argument rather than the listed side. The question for an Australian investor is whether a 9.9% implied yield overpays you for the office uncertainty, and the last edition's leasing data, double-digit effective rent growth and a supply pipeline 60% below average, is the beginning of a case that it does.
Where This Goes From Here
What happens to a 270bp gap? History offers three closing mechanisms, and none of them is "the share market apologises." Buybacks: at these implied caps, a REIT selling an asset at book and buying its own units is arbitraging its own table, and CIP has already sold $200m of assets at a 17% premium to book while its units trade 30% below (Centuria Industrial FY26 results). Take-privates: the record says wide fifth yields summon bids, and the bidders are the unlevered pension capital that has done every major deal since 2021. And transactions: every direct sale at book, like CIP's, or COF's Help Street sale at a 12.5% premium to book (Centuria Office FY26 results), is a data point the listed discount has to argue against. Note what all three mechanisms share: they resolve the gap through private-market action, at private-market prices. That is how the last cycle of this argument ended, and the evidence so far, assets selling at or above book into a 30% to 50% equity discount, is pointing the same way.
My view: constructive on the gap as an opportunity set. The retail and industrial pure-plays at 60bp to 170bp are pricing liquidity, not distress; the anomaly worth real work is office, where the share market's 9.8% to 10.0% and the direct market's 6.8% to 7.2% cannot both be the clearing price, and the early transactional evidence has sided with the direct market. The fifth yield will not tell you who is right. What it does, better than any other number in this series, is tell you exactly how large the disagreement is, in the only units that matter, and history is unambiguous about what arrives when the disagreement gets this wide: capital, with a bid.
Sources
- S&P Dow Jones Indices, S&P/ASX 200 A-REIT index (-18.06% year to date, late September 2026), https://www.spglobal.com/spdji/en/indices/equity/sp-asx-200-a-reit/
- CrossCourtAI A-REIT Asset Database V3 (every disclosed asset of 33 ASX/NZX REITs at 30 June 2026: 1,501 rows, A$198.7bn at share, value-weighted cap 5.61%; sector caps; like-for-like value moves Dec-25 to Jun-26; audited against annual reports). Full workings in generate_charts.py in this folder.
- Stockhead, For REITs, rising rates need not be a cat-astrophe, 2 October 2026 (UBS figures: 12.9x P/E, 6% yield; sector average 16.8% discount to NAV/NTA ex fund managers), https://stockhead.com.au/experts/criterion-for-reits-rising-rates-need-not-be-a-cat-astrophe/
- Green Street, glossary definitions of implied cap rate (the cap rate at which the NAV per-share estimate equals the current share price), https://silo.tips/download/green-street-advisors-glossary-of-commercial-real-estate-terms-2
- CenterSquare Investment Management, The REIT Cap Rate Perspective Q2 2025 (methodology: NOI adjusted for non-recurring items over equity plus debt less non-income-producing assets; US office REIT implied cap 7.91% vs private market 7.09%; all US REITs implied 5.71%), https://www.centersquare.com/wp-content/uploads/2025/07/CenterSquare-REIT-Cap-Rate-Perspective-Q2-2025_Summary-Report.pdf
- Centuria Industrial REIT FY26 results announcement, 11 August 2026 (NTA $4.01; gearing 34.9%, defined as total interest-bearing liabilities over total assets; portfolio WACR 5.8%; $200m of disposals at a 17% average premium to book), https://investorpa.com/announcement-pdf/20260811/326402.pdf
- Charter Hall Long WALE REIT FY26 results (NTA $4.71; balance sheet gearing 27.5%; portfolio WACR 5.4%), https://www.charterhall.com.au/News/news-article/2026/08/13/charter-hall-long-wale-reit-2026-full-year-results
- Charter Hall Retail REIT FY26 results (NTA $5.03; balance sheet gearing 30.9%; portfolio WACR 5.45%), https://www.charterhall.com.au/News/news-article/2026/08/06/charter-hall-retail-reit-2026-full-year-results
- HomeCo Daily Needs REIT FY26 results (NTA $1.56; gearing 35.7%; WACR 5.53%), via Investing.com and Kalkine coverage, https://uk.investing.com/news/company-news/homeco-daily-needs-fy26-slides-strong-operations-offset-by-rate-headwinds-93CH-4828969
- Region Group FY26 results announcement (NTA $2.57; pro forma gearing 34.1%), https://regiongroup.au/wp-content/uploads/2026/08/Region-Group-FY26-Results-Announcement.pdf
- Dexus Industria REIT FY26 results (NTA $3.425; look-through gearing 31.2%), via Kalkine coverage, https://kalkine.com.au/news/announcements/dexus-industria-reit-reports-fy26-ffo-of-176cps-exceeding-upgraded-guidance
- Centuria Office REIT FY26 results presentation, August 2026 (NTA $1.66; gearing 43.7%; portfolio WACR 7.04%; self-published implied cap rate of 9.38% at the 30 June 2026 unit price of $0.89; Help Street sale at a 12.5% premium to book), https://centuria.com.au/wp-content/uploads/2026/08/COF_FY26_Results_Presentation.pdf
- GDI Property Group FY26 annual results, 24 August 2026 (NTA $1.21; gearing 33%, net debt over tangible assets per the accounts; WACR 6.8%), https://www.gdi.com.au/wp-content/uploads/2026/09/3126954.pdf
- Cromwell Property Group FY26 results (NTA $0.575; gearing 31.6%), via Yahoo Finance earnings coverage, https://finance.yahoo.com/real-estate/articles/cromwell-property-group-asx-cmw-070135976.html
- Stock Analysis, prices 12 October 2026 (COF $0.8325; CIP $2.795; CLW $3.275; CQR $3.470; HDN $1.085; RGN $2.200; DXI $2.320; GDI $0.627; CMW $0.3375; delayed quotes), https://stockanalysis.com/
- Prior Property Stack editions: Take-Private Maths (nine-deal record; median completed bid +9.2% to NTA; National Storage +26.5%) and Hiking Into a Recovery (leasing and supply data), sources as published therein.