for institutional deal workflows


Five weeks ago, the night before the September RBA meeting, this newsletter published a piece called "Hiking Into a Recovery". It made three claims and closed with one sentence: the question was never whether rates rise, it is whether your rents rise faster. On Tuesday the RBA raised the cash rate 25 basis points to 4.85%, the fifth hike of 2026, and for the first time this cycle the Board split: six members voted to hike, three to hold (RBA, Statement by the Monetary Policy Board, 3 November 2026). Since the September piece went out, the Q3 data that tests all three claims has landed: CBRE's office figures, JLL's absorption numbers, a quarter of share prices, and the inflation print that forced the Board's hand.
Anyone can publish a thesis. The discipline that separates analysis from content is marking it to market when the data arrives, in public, including the parts that aged badly.
The short version: the sorting machine is running faster than I expected, in both directions. The rental growth exists but not without some discomfort.
The Market Snapshot: What the Brokers Are Saying
First, why Tuesday happened. The September quarter CPI, released 28 October, printed a 1.0% quarterly trimmed mean, taking the year-ended measure to 3.6%, already above the 3.3% the RBA's August forecasts had pencilled in for December, with headline inflation at 1.3% for the quarter and 4.3% for the year, the gap driven largely by fuel, which the trim excludes (ABS, Consumer Price Index, Australia, September quarter 2026; RBA, Statement on Monetary Policy, August 2026). Housing was the largest contributor at 5.2% annually (ABS, 28 October 2026). That print moved market pricing to roughly a 71% probability of a hike by the Monday before the meeting (RBA Rate Watch, 2 November 2026), and the Board delivered, with a statement that gives no comfort to anyone waiting for the top: inflation "remains elevated and recent data indicate that it is broadly based", it is "now expected to remain above 3 per cent for the coming year", and the Board sees an "increasing risk that higher inflation expectations will become embedded" (RBA, 3 November 2026). Five hikes in 2026: February, March, May, September, November. The cash rate has gone from 3.60% to 4.85% in nine months (RBA monetary policy decisions, 2026). The three dissents are worth holding onto, though: the Board itself is no longer unanimous that the machine needs to run harder.
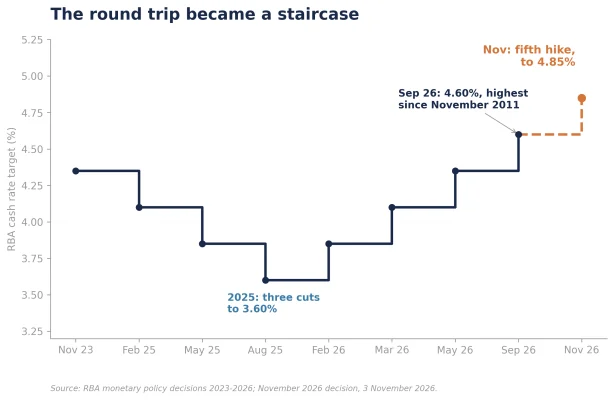
Now the property side of the ledger, and it is remarkable. CBRE reports Australian CBD prime effective rents climbed 3.1% quarter on quarter and 8.1% year on year in Q3 2026, which it calls "the highest level of rental growth recorded nationally since 2019" (CBRE, Australia CBD Office Figures Q3 2026, 14 October 2026). JLL has Sydney CBD prime gross effective rents up 8.3% over the year, Brisbane up 11.8%, and national CBD vacancy down half a point to 14.8%, with Sydney CBD vacancy at 13.6%, its lowest since Q3 2022 (JLL, Australian office markets remained robust through Q3, 12 October 2026). Melbourne CBD, the market everyone had given up on, posted 48,000 sqm of positive net absorption in the quarter after two negative quarters, pulling vacancy from 20.5% to 19.4% (JLL, 12 October 2026). And capital is behaving accordingly: Q3 office transactions reached $3.9 billion, with year-to-date volumes running about 50% above 2025 (CBRE, Q3 2026).
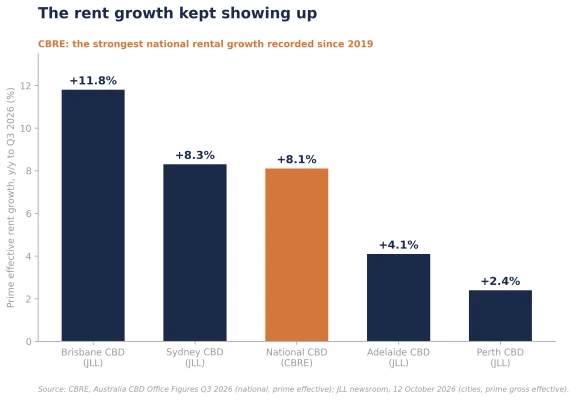
Set that against the rates picture and you have the full strangeness of this market on one page: the strongest rental growth in seven years, rising transaction volumes, and a central bank still hiking into it. September's piece argued this is not a contradiction but just the game. The three claims, in order are below.
View 1: "Rent Growth Is Doing the Heavy Lifting." Verdict: Held, With the Cleanest Evidence Yet
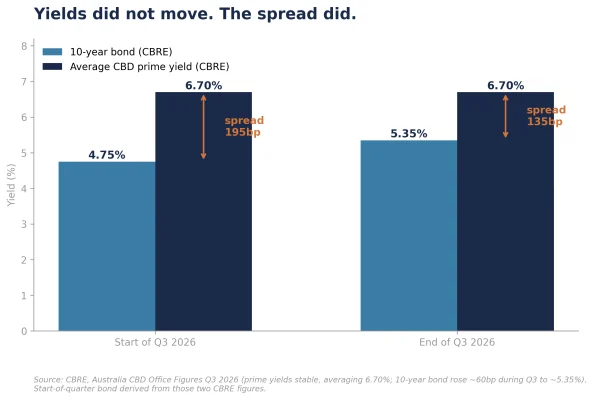
The September claim was that values were holding not on sentiment but on arithmetic: income rising fast enough to absorb the bond's punishment inside the spread. CBRE's Q3 figures provide the single best test of that mechanism this cycle has produced, because both halves come from the same page: prime yields were "largely stable" at an average of 6.70% across Australian CBDs, while the 10-year bond rose about 60 basis points during the quarter to settle around 5.35% (CBRE, Australia CBD Office Figures Q3 2026). The spread between average CBD prime yields and the risk-free rate compressed from roughly 195 to roughly 135 basis points in thirteen weeks, and prices did not blink.
What paid for that? Run the September absorption maths at the new numbers. At a 6.70% yield, value-neutral cap-rate expansion equals yield times rent growth: a year of the national 8.1% buys about 54 basis points, Sydney's 8.3% buys about 56, Brisbane's 11.8% buys about 79 (author's calculations; growth per CBRE Q3 2026 and JLL, 12 October 2026). In other words, one year of this year's rent growth almost exactly paid for one quarter's entire bond move. That is a knife edge, not a cushion: the mechanism worked, and it used up most of its annual budget doing it.
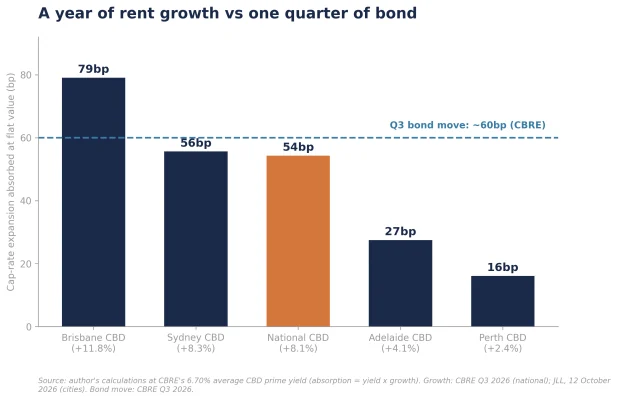
The September caution also stands, and the incentive edition of this newsletter measured it in detail: effective growth at these rates is substantially incentive compression, and incentives cannot compress forever. The grade here is held, not solved. The rents showed up this quarter. The bond will ask again next quarter.
View 2: "This Cycle Punishes Spread and Pays Growth." Verdict: Held, Well
September's second claim was that negative leverage had turned the prime end of the market over to unlevered capital, and that anyone holding tightly priced, bond-like income was exposed to a repricing with nothing underneath it but an allocation committee's patience. The listed market spent October grading that claim in public. On 2 October, six A-REITs sat at 52-week lows: Arena REIT down 43% for the year, Charter Hall Social Infrastructure down 28%, Charter Hall Long WALE down 22%, Centuria Industrial down 17%, Charter Hall Retail down 16%, BWP Trust down 11% (The Motley Fool Australia, 2 October 2026). Look at what those six have in common. They are not the office landlords everyone worries about. They are the long-WALE, defensive-income vehicles: childcare, triple-net retail, hardware. The market is not just selling property; it is selling spread, exactly the exposure the September piece said this cycle punishes.
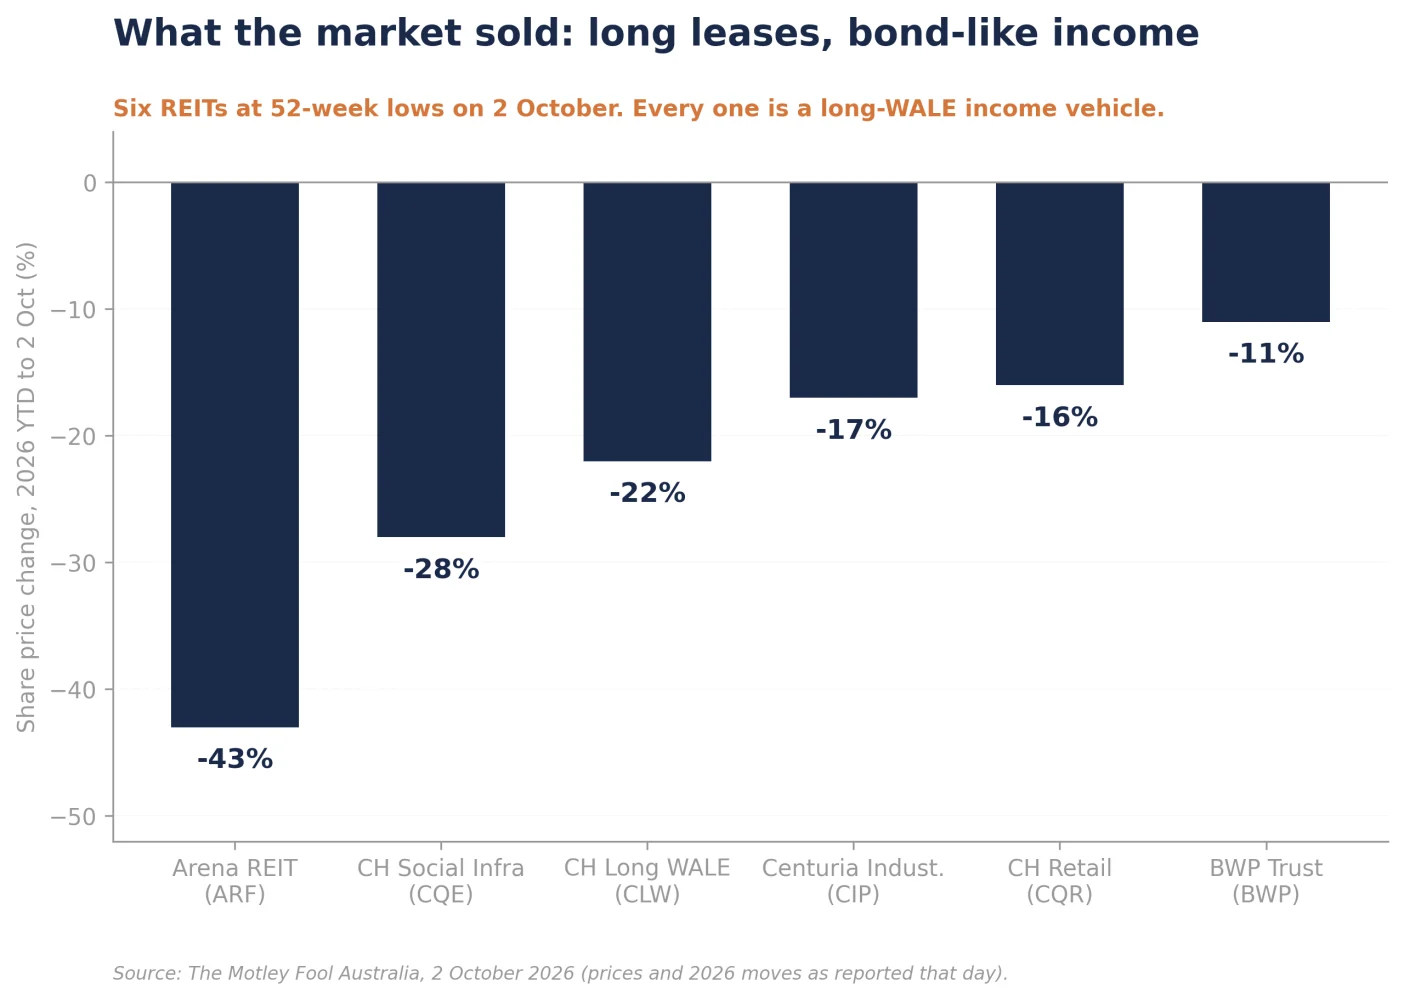
Meanwhile the other half of the sort: direct-market transactions up roughly 50% year to date (CBRE, Q3 2026), which is not what a buyers' strike looks like. The capital doing that buying is overwhelmingly the unlevered and lightly levered cohort September identified, because the arithmetic has only hardened: every additional 25 basis points feeds straight through bank bill rates into all-in debt costs, and the tightly priced end of the market that was already underwater on carry in September is further underwater now, so the geared marginal buyer stays priced out of exactly the assets the listed market is marking down. The listed market and the direct market are not disagreeing; they are pricing the same machine from opposite ends. One reprices daily and has marked the spread trade down 11% to 43%. The other reprices at valuation dates, and strikes its next ones on 31 December. Readers of the implied cap rate edition can draw that line themselves.
View 3: "The RBA Is Manufacturing the Next Rent Boom." Verdict: Held, and the Brokers Have Now Joined It
The September piece's contrarian claim was that every hike does two things: it pressures values today and kills the supply that would cap rents tomorrow. In September that argument rested mainly on Knight Frank's feasibility maths. One quarter later it is consensus among the people who count cranes. CBRE's Q3 headline: the supply outlook is "largely unchanged with the lowest supply over the next 5 years since the early 1990s" (CBRE, Australia CBD Office Figures Q3 2026). JLL's head of research Andrew Ballantyne, on the same data: "The development equation has become even more challenging over the past three months" (JLL, 12 October 2026). The past three months is precisely the period containing the September hike and the 60 basis point bond move. The machine is winding tighter in real time, on schedule.
The demand side keeps closing the loop: national vacancy falling, Sydney at four-year lows, Melbourne absorption turning positive, and tenants already responding the way scarce markets force them to. JLL's head of office leasing James Montague: "The tightness of the market is pushing tenants towards lease renewal rather than relocation" (JLL, 12 October 2026). Renewal-driven markets are where face rents finally move, because the landlord no longer buys the tenancy with an incentive. Tuesday's hike pushed the 2028-29 rent story another notch tighter while the market priced another notch of pain into this year's book values.
Where This Goes From Here
Marking the September call honestly it reads: three for three on direction, with one miss worth owning. I did not expect the listed sorting to run this hard this fast; a 43% fall in a childcare REIT in ten months is the market grading "own growth, not spread" with more violence than I argued for. If anything, the error in September was timidity.
So the stance doubles down, with the numbers updated. Own growth, not spread: income that can outrun a bond that just spent a quarter at 5.35% (CBRE, Q3 2026), bought at yields that clear an all-in debt cost that rises with every meeting, in markets where CBRE now says the next five years of supply are the thinnest since the early 1990s. The spread trade's pain is not finished; the December valuation round will put book marks against a bond that has moved 60 points in a quarter, and the listed market has already told you which way that argument runs. And the growth trade's fuel keeps arriving: the strongest effective rental growth since 2019, vacancy falling in four of six CBDs, and a central bank that, five hikes in, is still doing the supply side's dirty work for it.
My view: cautiously constructive over the medium term, unchanged, and more convinced. The test I set in September was whether your rents rise faster than the rates. Q3 answered it for this quarter: they did, almost to the basis point, and that is precisely how much margin there is for next quarter.
Sources
- Reserve Bank of Australia, Statement by the Monetary Policy Board: Monetary Policy Decision, Media Release 2026-30, 3 November 2026 (cash rate +25bp to 4.85%; vote 6-3; inflation "broadly based", "expected to remain above 3 per cent for the coming year"; "increasing risk that higher inflation expectations will become embedded"), https://www.rba.gov.au/media-releases/2026/mr-26-30.html
- Reserve Bank of Australia, monetary policy decisions 2025-2026 (2025 cuts to 3.60%; 2026 hikes February, March, May to 4.35%, September to 4.60%), https://www.rba.gov.au/monetary-policy/int-rate-decisions/2026/
- Australian Bureau of Statistics, CPI rose 4.3% in the year to September 2026, media release, 28 October 2026 (headline +1.3% q/q, +4.3% y/y; trimmed mean +1.0% q/q, +3.6% y/y; housing +5.2%), https://www.abs.gov.au/media-centre/media-releases/cpi-rose-43-year-september-2026
- RBA Rate Watch, November 2026 meeting page (market-implied probability of a rise 70.8% as at 2 November 2026), https://rbaratewatch.com/rba-meeting/november-2026/
- CBRE, Australia CBD Office Figures Q3 2026, 14 October 2026 (prime effective rents +3.1% q/q, +8.1% y/y, highest national growth since 2019; prime yields largely stable averaging 6.70%; 10-year bond rose ~60bp during Q3 to ~5.35%; Q3 transactions $3.9bn, YTD volumes ~50% above 2025; lowest 5-year supply outlook since the early 1990s; unemployment 4.6%), https://www.cbre.com.au/insights/figures/australia-cbd-office-figures-q3-2026
- JLL, Latest data indicates Australian office markets remained robust through Q3, 12 October 2026 (Sydney CBD prime gross effective rents +8.3% y/y; Brisbane +11.8% y/y; Adelaide +4.1%; Perth +2.4%; national vacancy 14.8%, down 0.5pp; Sydney vacancy 13.6%, lowest since Q3 2022; Melbourne net absorption +48,000 sqm, vacancy 20.5% to 19.4%; Ballantyne and Montague quotes), https://www.jll.com/en-au/newsroom/australian-office-markets-remained-robust-through-q3
- The Motley Fool Australia, 6 ASX REITs just hit 52-week lows. Do any brokers say buy?, 2 October 2026 (ARF -43%, CQE -28%, CLW -22%, CIP -17%, CQR -16%, BWP -11% in 2026 to that date), https://www.fool.com.au/2026/10/02/6-asx-reits-just-hit-52-week-lows-do-any-brokers-say-buy/
- Reserve Bank of Australia, Statement on Monetary Policy, August 2026, Table 3.1 (year-ended trimmed mean inflation forecast of 3.3% for December 2026), https://www.rba.gov.au/publications/smp/2026/aug/outlook.html