for institutional deal workflows

On 1 July the Australian Bureau of Statistics released its May building approvals data; Apartment approvals fell 30.0 per cent in a single month, to 2,877 dwellings (ABS, Building Approvals, Australia, May 2026). Within hours the story was everywhere: Australia's apartment market had fallen off a cliff.
It had not. On a twelve month rolling basis, apartment approvals are running at 48,112, up from 40,072 a year earlier, a gain of 20 per cent, and up 61 per cent from their trough of 29,919 in June 2024 (ABS, Building Approvals, Australia, May 2026, author's calculation from ABS Data API). The 30 per cent fall was a single noisy month in a series that has been recovering for close to two years. Anyone who built a thesis on that print will be corrected by the June data.
But underneath the noise I believe there is a real investment signal, and there is much less coverage of it. Australia is approving homes at close to its long run average and starting them at close to its long run average. It is finishing them at a rate not seen since the early 2010s. Having assessed residential and living sector opportunities in both an investment and advisory capacity, the number that concerns me is not an approval count. It is the ratio between what is under construction and what actually comes out the other end, and that ratio has broken in a way I do not think the market has priced.
The Market Snapshot: What the Brokers Are Saying
The sell side is close to unanimous that Australia is structurally undersupplied. Where they differ is on what is causing it and when it resolves.
CBRE forecasts apartment completions at roughly 60,000 annually against annual demand of approximately 75,000 units, an annual shortfall of around 15,000, and expects capital city vacancy to fall from 1.8 per cent in 2025 to 1.1 per cent by 2030, with median rents across 53 capital city precincts rising 27 per cent between 2025 and 2030 (CBRE, Apartment Vacancy, Rent and Price Outlook H1 2026). That is a forecast of sustained scarcity.
Knight Frank reports 11,944 build to rent units delivered nationally since 2018, with 11,368 under construction and a further 47,033 at development approval or early planning stage. Delivery is expected to taper from roughly 6,000 units in 2025 to around 4,000 in 2026, which they attribute to feasibility pressure rather than demand (Knight Frank, BTR Market Update, August 2025). Note the shape of that pipeline: four times as many units sitting at approval stage as are actually being built.
JLL data shows the same pattern at city level. Melbourne's inner precinct recorded just over 2,000 apartment completions in 2025, a ten year low, while Brisbane completed only 458 apartments in the first quarter of 2026 against 2,706 under construction (JLL, Melbourne Residential Market Dynamics Q1 2026; JLL, Brisbane Residential Market Dynamics Q1 2026).
Colliers describes Australia moving toward a rental first new housing market, driven by structural dwelling undersupply, national vacancy below 2 per cent and rent growth exceeding 25 per cent over five years, and points to the "missing middle" of mid income households in middle ring suburbs as the widest gap (Colliers, Australian Living Capital Markets Investment Review and Outlook 2026, February 2026).
Cushman & Wakefield argues the mismatch is compositional, noting that supply continues to prioritise larger format housing while household sizes shrink, and projecting the number of renters aged 65 and over to rise 95 per cent by 2031 (Cushman & Wakefield, Rebalancing Australia's Housing Mismatch, March 2026).
Savills expects Australian real estate investment to rise nearly 20 per cent in 2026, though it is worth noting that its top Australian picks are prime office, suburban retail and logistics rather than the living sectors (Savills, Impacts: Our Regional Real Estate Forecasts for 2026).
Consensus, then, is that supply is short and rents are going up. I agree. What I want to challenge is the mechanism almost everyone is using to forecast how short.
View 1: The Supply Forecasts Are Built On A Broken Assumption
Almost every residential supply forecast in this market, including the ones underpinning institutional rent growth assumptions, starts from approvals and applies a conversion rate.
The National Housing Supply and Affordability Council is explicit about it. In its April 2026 report the Council notes that there were 196,000 building approvals in the year to February 2026 alongside 196,000 dwelling commencements in 2025, and concludes that because "historically, 97.8 per cent of approved dwellings are completed," this suggests "an improvement in the outlook for housing supply" (NHSAC, State of the Housing System 2026, April 2026).
That 97.8 per cent is doing an enormous amount of work but its calculation mechanic is my question.
A conversion rate tells you what share of approvals eventually become homes. It says nothing about when. And the timing is where the system has broken. Take the two ABS series that actually matter: dwellings under construction, and dwellings completed. Divide the second by the first and you get what I would call the delivery ratio, the share of the construction pipeline that clears in a year.
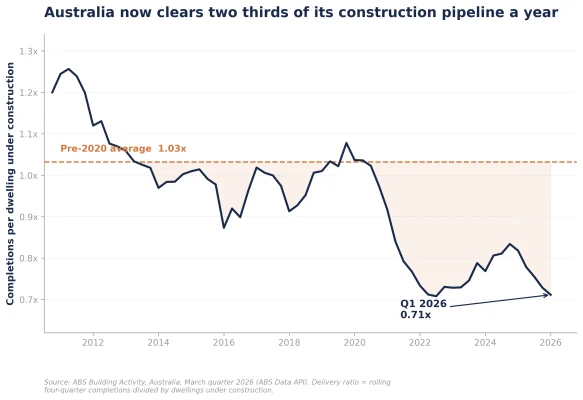
From 2010 to 2019 that ratio averaged 1.03x (ABS, Building Activity, Australia, March quarter 2026, author's calculation). Australia completed slightly more homes each year than it had under construction at any given moment, which is what you would expect from a system with a build time of around twelve months. It held at 1.01x in the March quarter of 2015 and 1.01x in the March quarter of 2019.
In the March quarter of 2026 it was 0.71x.
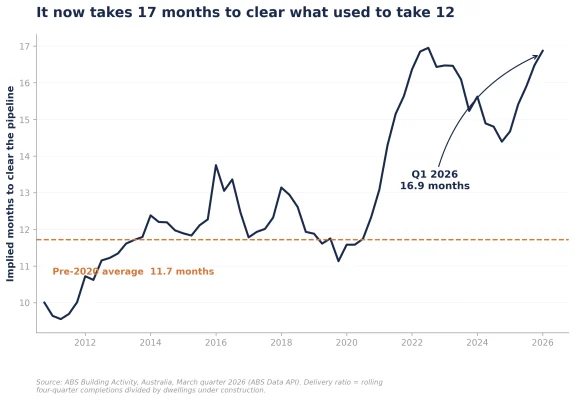
The implied time to clear the pipeline has gone from 11.7 months to 16.9 months, an extension of about 44 per cent (ABS, Building Activity, Australia, March quarter 2026, author's calculation). This is not a one quarter aberration. The ratio has sat below 0.85x for seventeen consecutive quarters. It briefly recovered to 0.83x in late 2024 and has since relapsed.
So both things can be true. NHSAC can be right that 97.8 per cent of approvals eventually complete, and the supply forecast can still be badly wrong, because a home delivered five months late is not the same asset as a home delivered on time. For a rent forecast, timing is the entire question. If you are underwriting a lease up in 2028 against a supply wave you expect in 2028, and that wave lands in 2029, you have mispriced the rent.
View 2: The Queue Is Compounding, Not Clearing
The second order effect is worse than the first.
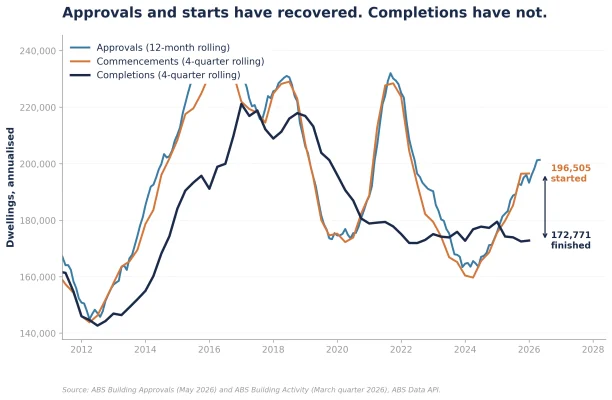
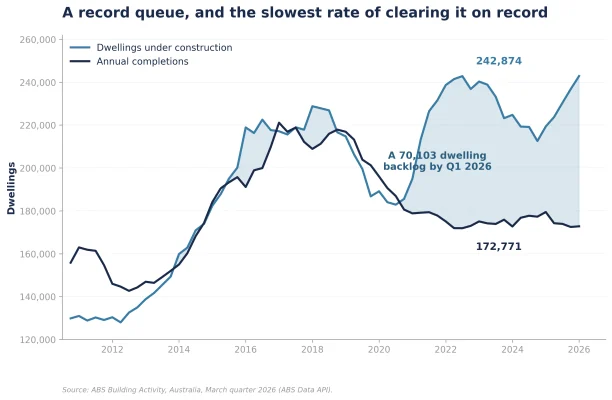
In the year to March 2026 Australia started 196,505 dwellings and completed 172,771 (ABS, Building Activity, Australia, March quarter 2026). The difference, close to 24,000 homes a year, does not disappear. It joins a queue that is already moving at two thirds speed.
That queue now stands at 242,874 dwellings under construction, the highest on record (ABS, Building Activity, Australia, March quarter 2026). To put that in perspective, in the March quarter of 2015 there were 182,355 dwellings under construction and 184,071 completed in the preceding year. The pipeline and the annual output were the same size. Today the pipeline exceeds annual output by 70,103 dwellings.
Australia has, in effect, accumulated a backlog roughly equivalent to five months of national housing production, and it is still growing.
This is the part that should concern anyone underwriting new supply. A record pipeline reads, superficially, like a supply threat. It is the opposite. A pipeline that large moving that slowly is evidence that the delivery system is at capacity. Adding more approvals to it does not accelerate output, it lengthens the queue. NHSAC's own framing concedes the point, observing that "the recent uptick in dwelling approvals has not yet translated into an increase in dwelling completions" (NHSAC, State of the Housing System 2026, April 2026).
The composition makes it worse. Higher density completions totalled just 62,000 in 2025, some 41.4 per cent below the peak of 106,000 in the year to September 2017 (NHSAC, State of the Housing System 2026, April 2026). Attached dwelling approvals are running at 79,739 on a twelve month basis, still 26 per cent below the 107,097 recorded in May 2015 (ABS, Building Approvals, Australia, May 2026, author's calculation). Houses, by contrast, have fully recovered to 117,012, above their 2015 level.
Australia is meeting its approval numbers with the format that is quickest to build and least useful in the markets where the shortage actually binds.
View 3: There Is No Cost Off-Ramp In This Cycle
The standard rebuttal is that this is cyclical. Costs spiked, the fixed price contract cohort from 2021 and 2022 washed through, builders failed, and as that clears the ratio mean reverts.
I do not think the data supports that.
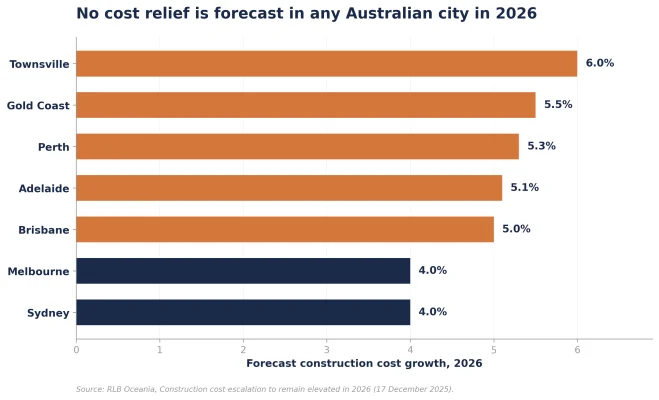
RLB forecasts construction cost growth in 2026 of 4.0 per cent in Sydney and Melbourne, 5.0 per cent in Brisbane, 5.1 per cent in Adelaide, 5.3 per cent in Perth, 5.5 per cent on the Gold Coast and 6.0 per cent in Townsville, citing skilled labour shortages, low productivity, insolvency risk and limited competition (RLB Oceania, Construction cost escalation to remain elevated in 2026, 17 December 2025). There is no city in the country where costs are forecast to fall.
Insolvency is still removing capacity. In the 2025-26 financial year 3,472 construction companies entered external administration or had a controller appointed, making construction the worst affected industry in the economy by a wide margin, with the second worst, accommodation and food services, recording 2,078 (ASIC insolvency statistics, reported 22 July 2026). Every one of those failures strands a part built project and re-tenders it at a higher price.
And the underlying problem is not cyclical at all. NHSAC finds that the number of dwellings completed per hour worked has declined by 53 per cent over the last 30 years, and that dwelling construction labour productivity has fallen around 12 per cent over that period while the broader economy's rose 49 per cent (NHSAC, State of the Housing System 2026, April 2026). A sector that has lost half its physical productivity in a generation does not snap back because a cost cycle turns.
There is also new competition for the same trades. In May 2026 the value of non-residential building approved rose 41.0 per cent in a single month to A$10.83 billion, while the value of residential building approved fell 5.7 per cent to A$10.24 billion (ABS, Building Approvals, Australia, May 2026). Data centres, defence and infrastructure are bidding for the same labour pool, and they are not price sensitive in the way an apartment feasibility is.
NHSAC models the downside explicitly. A 6 per cent peak increase in construction costs would lower completions by 10,000 to mid-2029; a 10 per cent increase would lower them by 33,000, and the Council notes the risks are skewed to the downside (NHSAC, State of the Housing System 2026, April 2026).
Nor is the revenue side coming to the rescue. Cotality, the business formerly known as CoreLogic, reports Sydney dwelling values fell 1.2 per cent in June and Melbourne 1.0 per cent, with the median vendor discount across the combined capitals widening to 3.6 per cent (Cotality, Monthly Housing Chart Pack, 16 July 2026). Feasibility is a spread between cost and end value. Costs are forecast to rise in every capital and end values in the two largest markets are falling. That spread is not closing on its own.
Where This Goes From Here
My view: cautiously bullish on completed, income producing residential stock over the medium term, and considerably more cautious on anything that requires a construction program to reach stabilisation.
The logic is straightforward. If the delivery ratio stays near 0.71x, then the supply response the consensus is forecasting arrives materially later than the consensus expects. Vacancy compresses toward CBRE's 1.1 per cent projection sooner and stays there longer, and the 27 per cent rent growth they forecast to 2030 becomes a floor rather than a base case (CBRE, Apartment Vacancy, Rent and Price Outlook H1 2026). Anything already built, leased and generating income is protected by a moat that is being widened by the construction sector's own dysfunction.
The corollary is that a development approval should no longer be valued as a proxy for future supply, by developers or by the people underwriting them. Knight Frank's 47,033 build to rent units at approval or early planning stage are not 47,033 future apartments; they are an option on a delivery system running 44 per cent slower than it did a decade ago (Knight Frank, BTR Market Update, August 2025). Priced as the former, that pipeline is expensive. Priced as the latter, parts of it are interesting.
Three things would change my mind. A delivery ratio that recovers through 0.85x and holds for four consecutive quarters. Construction cost growth printing below 3 per cent in Sydney and Melbourne. Or a genuine productivity intervention, whether modular, prefabrication or procurement reform, that shows up in dwellings completed per hour worked.
Until then, the honest reading of the ABS data is that Australia has spent three years getting better at approving homes and no better at finishing them. There is a reasonable argument that the entire policy conversation, and a good deal of the capital allocated on the back of it, has been aimed at the wrong end of the pipe. Time will tell...
---
Sources
1. Australian Bureau of Statistics, Building Approvals, Australia, May 2026, released 1 July 2026. https://www.abs.gov.au/statistics/industry/building-and-construction/building-approvals-australia/latest-release
2. Australian Bureau of Statistics, Building Activity, Australia, March quarter 2026. https://www.abs.gov.au/statistics/industry/building-and-construction/building-activity-australia/latest-release
3. ABS Data API (data.api.abs.gov.au), dataflows BA_GCCSA (Building Approvals) and BUILDING_ACTIVITY (Building Activity). All rolling totals, the delivery ratio and implied conversion times in this article are the author's calculations from these series.
4. National Housing Supply and Affordability Council, State of the Housing System 2026, April 2026. https://nhsac.gov.au/sites/nhsac.gov.au/files/2026-04/ar-state-housing-system-2026.pdf
5. CBRE, Apartment Vacancy, Rent and Price Outlook H1 2026. https://www.cbre.com.au/insights/reports/apartment-vacancy-rent-and-price-outlook-h1-2026
6. Knight Frank, BTR Market Update, August 2025. https://www.knightfrank.com.au/blog/2025/08/19/-2025-to-be-the-second-record-year-of-supply-for-btr-before-a-delivery-dropoff-in-2026
7. JLL, Melbourne Residential Market Dynamics Q1 2026. https://www.jll.com/en-au/insights/market-dynamics/melbourne-residential
8. JLL, Brisbane Residential Market Dynamics Q1 2026. https://www.jll.com/en-au/insights/market-dynamics/brisbane-residential
9. Colliers, Australian Living Capital Markets Investment Review and Outlook 2026, February 2026. https://www.colliers.com.au/en-au/research/australian-investment-review-2026-living
10. Cushman & Wakefield, Rebalancing Australia's Housing Mismatch, March 2026. https://www.cushmanwakefield.com/en/australia/insights/rebalancing-australias-housing-mismatch
11. Savills, Impacts: Our Regional Real Estate Forecasts for 2026. https://impacts.savills.com/market-trends/our-regional-real-estate-forecasts-for-2026.html
12. RLB Oceania, Construction cost escalation to remain elevated in 2026, 17 December 2025. https://www.rlb.com/oceania/insight/construction-cost-escalation-to-remain-elevated-in-2026/
13. ASIC insolvency statistics, FY2025-26, as reported by Accountants Daily, 22 July 2026. https://www.accountantsdaily.com.au/business/22687-company-insolvencies-climb-to-14-152-for-fy-2025-26
14. Cotality (formerly CoreLogic), Monthly Housing Chart Pack, July 2026, 16 July 2026. https://www.cotality.com/au/insights/articles/monthly-housing-chart-pack-july-2026