for institutional deal workflows


Australia's office vacancy rate just hit 15.9% (Property Council of Australia, February 2026). That is the highest level in thirty years. If you stopped reading there, you would conclude that office is a sector in crisis, and you would be wrong (with nuance...come with me here).
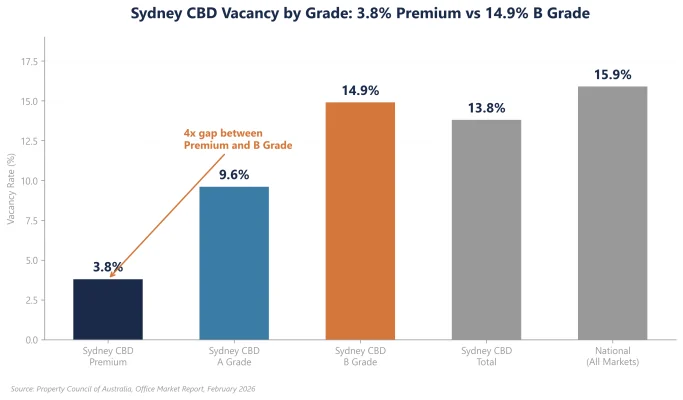
The national vacancy number is a blended fiction. It averages CBD markets at 14.8% with non-CBD markets bleeding at 18.5% (Property Council of Australia, February 2026). Within Sydney's CBD, where the bifurcation is most pronounced, premium assets trade at 3.8% vacancy while B Grade buildings sit at 14.9% and lower-grade stock runs higher still. It blends Sydney's CBD core, where no new supply is coming in 2026, with Melbourne's Southbank, where structural oversupply persists. It treats a brand-new, 5.5-star NABERS building and a 1980s concrete tower as the same product, when tenants, investors, and lenders increasingly do not.
As someone who has assessed Australian office market opportunities in both an investment and advisory capacity, the shift in tone around prime office over the past six months has been striking. The macro environment has turned meaningfully harder since February, with the RBA hiking the cash rate three times to 4.35% (as of this morning) and the Hormuz oil shock pushing inflation expectations sharply higher. Counterintuitively, this is supportive of the prime office thesis. Higher rates and energy costs starve new supply, accelerate the obsolescence of secondary stock, and amplify the scarcity premium for buildings that work. My view is cautiously bullish on prime, cautious to bearish on secondary, and selective above all else.
The Market Snapshot: What the Brokers Are Saying
The broker community has converged on a single thesis over the past six months: the office market is bifurcating, and the gap between the best and worst assets is widening.
Property Council of Australia released its February 2026 Office Market Report showing national vacancy rose from 15.2% to 15.9% over the six months to January 2026, with CBD markets at 14.8% and non-CBD at 18.5% (PCA, February 2026). The headline disguises the grade-level divergence in the major CBDs. In Sydney CBD, where the bifurcation is sharpest, Premium vacancy sits at just 3.8%, A Grade at 9.6%, and B Grade at 14.9% (PCA, February 2026). Net absorption tells a different story to vacancy: national CBD net absorption reached 135,279 square metres over the twelve months to January 2026, the strongest occupier demand recorded since 2022 (PCA, February 2026).
CBRE forecasts that average prime office yields in the Sydney CBD tightened 25 basis points in 2025 to 5.75%, the first compression since 2021 (CBRE, Pacific Real Estate Market Outlook 2026). CBRE projects net effective rents to grow 3.3% in Sydney in 2026, with Perth expected to deliver rental growth of at least 25% over the next five years as market rents catch up to economic rents (CBRE, 2026). Total investment volumes across all sectors are forecast to grow 15% to approximately A$36 billion in 2025 and 23% to approximately A$44 billion in 2026 (CBRE, Australia's Capital Markets Review).
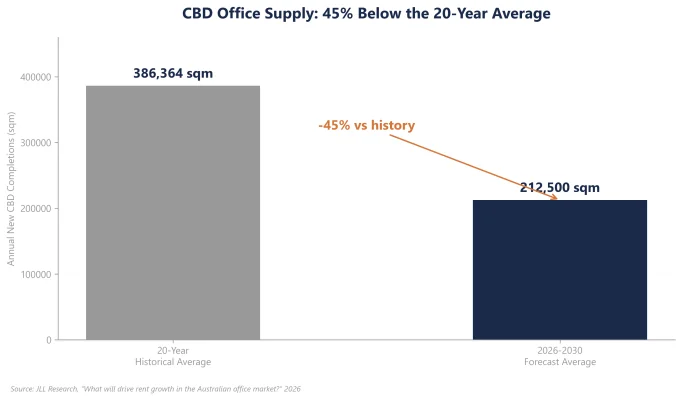
JLL forecasts new CBD office completions will average just 212,500 square metres annually between 2026 and 2030, approximately 45% below the 20-year historical average (JLL Research, 2026). Sydney CBD has no new office completions scheduled for 2026, with the next substantial supply wave not arriving until 2027 (JLL, 2026).
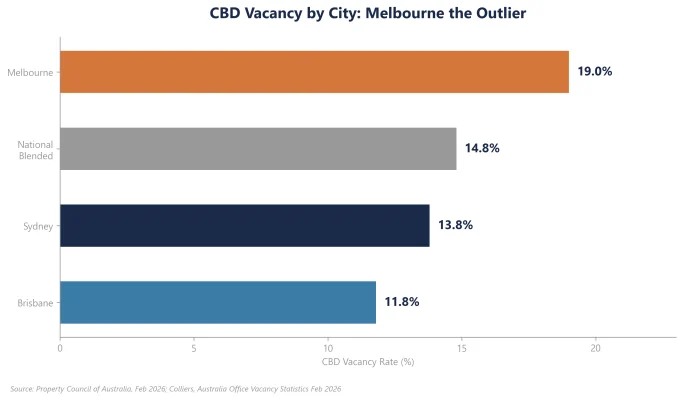
Colliers reports CBD vacancy by city diverging materially: Sydney held at 13.8%, Melbourne rose to 19.0% (the weakest major market), Brisbane edged to 11.8%, while Perth and Adelaide compressed further on the back of strong return-to-office attendance (Colliers, Australia Office Vacancy Statistics February 2026). Colliers forecasts effective CBD prime rent growth of 5.5% for 2025 with further acceleration as the supply pipeline thins (Colliers, 2026).
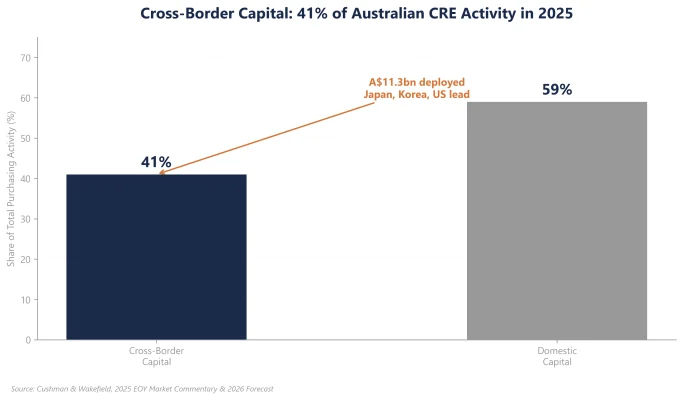
Cushman & Wakefield has framed the bifurcation in capital flows: cross-border investors emerged as the most active buyer type in Australia's capital markets in 2025, accounting for 41% of all purchasing activity, with Japan, South Korea, and the United States contributing the majority of cross-border capital and deploying A$11.3 billion in assets across all sectors (Cushman & Wakefield, 2025 EOY Market Commentary).
Knight Frank notes that incentives in the Sydney CBD are averaging 40.1% for non-premium stock, while premium incentives have begun to compress as availability tightens (Knight Frank, Sydney CBD Office Market Report, February 2026). Knight Frank's Melbourne report flags that Southbank and Docklands face structural oversupply that no demand recovery alone can absorb (Knight Frank, Melbourne CBD Office Market Report, February 2026).
View 1: The Supply Cliff Is Real, and the 2026 Macro Shock Has Made It Sharper
The forward supply picture was already extraordinary before the macro turned. Now it is something close to a structural floor under prime rents.
JLL forecasts new CBD completions averaging 212,500 square metres per year through 2030, 45% below the 20-year historical average (JLL Research, 2026). CBRE notes that most Australian CBD markets will have four years with no new supply over the coming five-year period (CBRE, Pacific Real Estate Market Outlook 2026). Sydney has no completions in 2026. The next wave in 2027 includes 55 Pitt Street (63,700 square metres, approximately 40% pre-committed to MinterEllison and Baker McKenzie), Atlassian Central (~58,000 square metres, fully pre-committed to Atlassian), and Chifley South (over 50,000 square metres, over 55% pre-committed including UBS and Gilbert + Tobin) (Mirvac, February 2026; Dexus, 2026; Charter Hall, 2025). Net new speculative space arriving in Sydney over the next 24 months is essentially zero.
Then came the rate shock. The RBA cut the cash rate three times in 2025, from 4.35% to 3.60%, but inflation reignited in the second half of the year. The Board hiked 25 basis points in February/March/April 2026, pushing the cash rate back to 4.35% (RBA, March 2026). Trimmed mean inflation is forecast at 3.7% for the year to June 2026 and is not expected to return to the middle of the 2-3% target range until mid-2028 (RBA, Statement on Monetary Policy, March 2026). The realistic range for the rest of 2026 is a hold at 4.35% or one further hike. Cuts are off the table (we have been surprised here before however...)
Layered on top is the Hormuz shock. The 2026 Strait of Hormuz crisis, triggered by the US air campaign against Iran in late February, has seen Brent crude surpass US$126 per barrel and Dubai crude hit a record US$166 (Reuters, March 2026). The strait carries approximately 25% of the world's seaborne oil trade and 20% of global LNG. Westpac estimates the conflict has already added a full percentage point to CPI, while Oxford Economics projects that a prolonged disruption would push global inflation to 7.7% and tip Australia into a sharp GDP contraction (Westpac, March 2026; Oxford Economics, 2026).
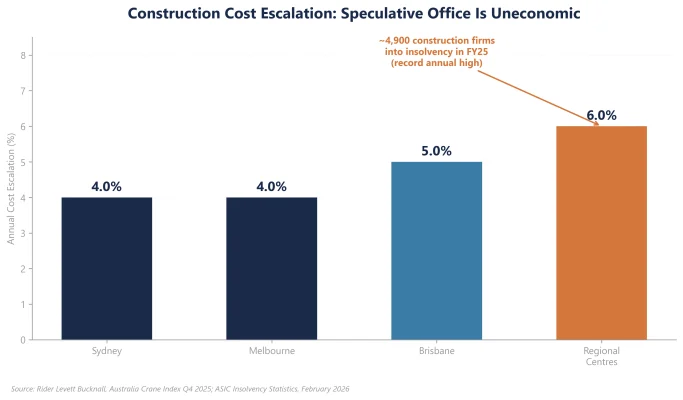
For office supply, this macro mix is devastating to anyone trying to greenlight a new tower. Construction cost escalation is running at 4.0% in Sydney and Melbourne, 5.0% in Brisbane, and up to 6.0% in regional centres (Rider Levett Bucknall, Q4 2025 Crane Index). Construction insolvency appointments hit approximately 4,900 in the 2024-25 financial year, up from 3,490 the prior year and more than double the FY2021-22 figure of 2,259, the highest annual total in ASIC's published series since 1999-2000 (ASIC Insolvency Statistics, 2026). Senior debt for speculative office is now priced at levels where the project IRR cannot clear the cost of capital without 70%-plus pre-commitment, and that pre-commitment is itself harder to secure when tenants are right-sizing post-hybrid.
The supply tap is shut. And in a market where Sydney CBD premium vacancy is already at 3.8% and national net absorption is at a four-year high, that tap being shut is the single most important variable in the prime rental trajectory.
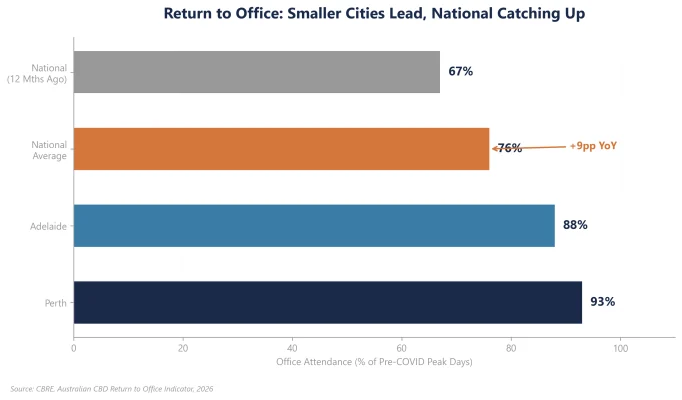
Demand is recovering alongside this supply collapse. Return-to-office attendance is averaging 76% of pre-COVID peak across the national CBDs, up from 67% twelve months ago (CBRE, Australian CBD Return to Office Indicator, 2026). Perth and Adelaide are running at 93% and 88% respectively. The combination of accelerating demand and frozen supply is what produces step-change rental growth, and the broker forecasts of 3.3% (Sydney) to 25% over five years (Perth) likely understate the upside if the macro stays hot.
View 2: The Bifurcation Is Structural, and the Energy Shock Made It Permanent
The other side of the trade is darker.
B Grade and C Grade office buildings face a structural problem, not a cyclical one. Hybrid working has permanently reduced the space per worker that most tenants require (Colliers, Rewiring Workplace Realities 2026). Corporate tenants are consolidating into fewer, higher-quality buildings, leaving older, less efficient stock without a natural tenant base. Incentives in Sydney CBD non-premium stock are averaging 40.1%, which is shorthand for a market where face rents are a fiction (Knight Frank, February 2026).
The Hormuz energy shock has made this bifurcation worse, not better. Tenants signing 7 to 10 year leases now have to model elevated electricity, gas, and embodied carbon costs across the full term of occupancy. A 5.5-star NABERS building with rooftop solar, efficient HVAC, and modern thermal envelope can absorb a doubling of energy prices with minimal pass-through. A 1980s concrete tower with single-glazed windows and gas-fired plant cannot. The all-in occupancy cost gap between premium and secondary is widening, even when face rent gaps are stable.
JLL's national stock analysis shows only 31% of Sydney CBD office stock and 28% of Melbourne CBD stock currently achieves a NABERS Energy rating of 5.5 stars or above, the threshold most institutional tenants now require in green leases (JLL, The Race to Decarbonise Australian Cities, 2023). The smaller markets are materially behind: Brisbane sits at 24%, Canberra 17%, Perth 15%, and Adelaide 14% (JLL, 2023). The majority of national stock is functionally misaligned with where corporate procurement is heading. For institutional tenants whose own scope 3 emissions reporting is now legally enforceable under the new mandatory climate disclosure regime, leasing space in a building that cannot decarbonise is a board-level risk, not just an ESG nice-to-have.
The conversion thesis is the only credible exit for a meaningful slice of secondary stock. Hassell research conducted for the Property Council of Australia identified 86 office buildings in Melbourne's CBD alone that could be repurposed into housing, potentially delivering up to 12,000 new homes (Hassell / PCA, From Office to Home). Adelaide's Adaptive Reuse City Housing Initiative has identified more than 150 buildings with conversion potential. In a country tracking a shortfall of approximately 220,000 dwellings against the 1.2 million National Housing Accord target by June 2029, with the target now not expected to be met until September 2030, converting structurally obsolete office stock into residential is not just an investment thesis, it is a policy imperative (National Housing Supply and Affordability Council, State of the Housing System 2026).
The conversion trade is real, but it is not easy. Floor plate depth, services infrastructure, planning, and embodied carbon write-off all create complexity. The buildings that work for conversion are typically the older, smaller, side-core towers with reasonable column grids, not the deep-floor 1980s slabs. For investors who can navigate the engineering and planning constraints, the spread between secondary office acquisition pricing and end-state residential value is one of the most compelling value-creation opportunities in Australian real estate today.
View 3: Capital Is Already Moving, and the Window for Mispricing Is Closing
The investment market is already pricing the bifurcation thesis, and the window for mispricing is narrower than it looks.
Sydney CBD prime office yields tightened 25 basis points in 2025 to an average of 5.75%, the first compression since 2021 (CBRE, 2026). This happened despite the rate environment moving against the asset class. The signal is unambiguous: when supply is structurally constrained, yields compress through the rate cycle, not with it.
Cross-border capital is leading. Cross-border investors accounted for 41% of all Australian capital markets activity in 2025, deploying A$11.3 billion across sectors (Cushman & Wakefield, 2025 EOY Market Commentary). Japanese, Korean, and US capital have been the most active. National office transaction volumes in 2025 surpassed the 2024 total of A$7.3 billion, and CBRE forecasts total investment volumes growing 15% in 2025 and 23% in 2026 to approximately A$44 billion (CBRE, Australia's Capital Markets Review).
The arbitrage that allocators are pricing is straightforward. Prime office in Sydney trades at 5.75% on stabilised income. The five-year ACGB sits around 4.70% in the post-hike environment, roughly 40 basis points above the cash rate as the curve prices a higher-for-longer regime (RBA, Capital Market Yields F2, May 2026). The positive spread to prime cap rates of roughly 100 basis points is tight by historical standards but is widening as rents grow into the supply cliff. Add ~3.0-5.0% rental growth per CBRE and Colliers forecasts, layer in the supply-driven scarcity premium, and the IRR maths starts to work for any allocator with a five-to-seven-year hold.
The risk to the thesis is execution. Investors buying B Grade hoping for a beta rally will be disappointed. Investors buying premium assets in supply-constrained markets, with credit-tenant covenants and ESG-aligned NABERS profiles, are positioning for a cycle that the broker community now openly endorses.
The window for entering at 2024-2025 reset pricing is closing. Sydney prime cap rates have already moved 25 basis points. As more cross-border capital lands and more domestic super funds rotate back into office (after two years of underweight allocation), the pricing window narrows. The conversations I have with capital allocators today are not about whether to allocate to office. They are about which sub-segment, which city, and which manager.
Where This Goes From Here
The Australian office market is not recovering uniformly. It is splitting into two distinct markets with fundamentally different trajectories, and the 2026 macro shock has made the split sharper, not narrower.
Premium and A Grade assets in supply-constrained CBDs are entering a period of genuine scarcity. National net absorption is at its strongest since 2022 (PCA, February 2026). Return-to-office momentum is building (CBRE, 2026). The supply pipeline is 45% below the 20-year average and Sydney has no new completions in 2026 (JLL, 2026). The Hormuz energy shock and RBA hikes have killed new speculative starts. The rental growth trajectory for quality office is the best it has been since before COVID.
Secondary stock faces a structural reckoning. Some of it will be repositioned through significant capital expenditure. Some will find new life as residential conversion. Some will simply decline in value until the land component alone drives the economics. The mandatory climate disclosure regime and the energy cost pass-through from Hormuz make the outlook for non-decarbonisable stock worse, not better.
My view is cautiously bullish on prime, bearish on secondary, and selective above all else. The supply cliff is real, the demand recovery is underway, the pricing reset has created entry points that were not available two years ago, and the 2026 macro shock is amplifying every one of those drivers. CBRE forecasts total returns for CBD office assets to exceed historical averages over the next three years, led by Brisbane and Canberra (CBRE, 2026).
But selectivity is everything. The spread between the best and worst office assets in Australia is wider than it has ever been. The investors who outperform from here will be those who understand that 15.9% is a headline, not reflective of a broader thesis.
---
Sai Naicker is the Founder and CEO of CrossCourtAI, having assessed Australian office market opportunities in both an investment and advisory capacity. He speaks with capital allocators, occupiers, and advisors across Australia daily.
---
Sources
1. Property Council of Australia, "Office Market Report," February 2026. https://www.propertycouncil.com.au/news-research/research/office-market-report
2. Colliers, "Australia Office Vacancy Statistics February 2026." https://www.colliers.com.au/en-au/news/australia-office-vacancy-statistics-february-2026
3. CBRE, "Pacific Real Estate Market Outlook 2026." https://www.cbre.com.au/insights/reports/pacific-real-estate-market-outlook-2026
4. CBRE, "Commentary: Property Council office vacancy statistics August 2025." https://www.cbre.com.au/press-releases/cbre-commentary-property-council-of-australia-office-vacancy-satistics-august-2025
5. CBRE, "Australia's Capital Markets Review: Insights and Forecasts for 2026." https://www.cbre.com.au/insights/talking-property-with-cbre/australias-capital-markets-review
6. JLL Research, "What will drive rent growth in the Australian office market?" 2026. https://research.jllapsites.com/what-will-drive-rent-growth-in-the-australian-office-market/
7. Cushman & Wakefield, "2025 EOY Market Commentary & 2026 Forecast." https://www.cushmanwakefield.com/en/australia/news/2025/12/2025-eoy-market-commentary-and-2026-forecast
8. Tenant CS, "Australian CBD Office Leasing Market Snapshot Q3 2025." https://tenantcs.com/blog/australian-leasing-market-snapshot
9. Knight Frank, "Melbourne CBD Office Market Report February 2026." https://content.knightfrank.com/research/305/documents/en/melbourne-cbd-office-market-february-2026-12694.pdf
10. Knight Frank, "Sydney CBD Office Market Report," February 2026.
11. CBRE, "Australian CBD Return to Office Indicator," 2026. https://www.cbre.com.au/insights/reports/cbre-australian-cbd-return-to-office-indicator
12. Hassell / Property Council of Australia, "From Office to Home: Radical Re-use research." https://www.hassellstudio.com/research/from-office-to-home-new-research-explores-the-case-for-radical-re-use
13. Green Street, "Australian prime office rents on track to return to pre-pandemic levels," 2025. https://www.cromwell.com.au/wp-content/uploads/sites/2/2025/05/Green_Street_News_Australian-prime-office-rents-on-track-to-return-to-pre-pandemic-levels.pdf
14. Colliers, "Rewiring Workplace Realities in 2026." https://www.colliers.com.au/en-au/research/rewiring-workplace-realities-2026
15. Property Council of Australia, "Return to office gathers pace." https://www.propertycouncil.com.au/property-australia/return-to-office-gathers-pace
16. Reserve Bank of Australia, "Statement on Monetary Policy," March 2026. https://www.rba.gov.au/publications/smp/
17. Reuters, "Brent crude surges past $126 as Hormuz crisis deepens," March 2026.
18. Westpac Economics, "March 2026 Market Outlook: Hormuz inflation pass-through."
19. Oxford Economics, "Strait of Hormuz: Global macro scenarios," 2026.
20. Rider Levett Bucknall, "Australia Crane Index Q4 2025." https://www.rlb.com/oceania/insight/crane-index-australia/
21. ASIC Insolvency Statistics, February 2026. https://asic.gov.au/regulatory-resources/find-a-document/statistics/insolvency-statistics/
22. National Housing Supply and Affordability Council, "State of the Housing System 2026," April 2026. https://nhsac.gov.au/news/state-housing-system-2026
23. JLL, "The Race to Decarbonise Australian Cities: What has changed in a year?" 2023. https://www.jll.com.au/en/trends-and-insights/research/the-race-to-decarbonise-australian-cities
24. Mirvac, "Baker McKenzie signs on to Mirvac's 55 Pitt Street," February 2026. https://www.mirvac.com/en/about/news-and-media/baker-mckenzie-signs-on-to-mirvacs-55-pitt-street
25. Dexus, "Atlassian Central, 8-10 Lee Street, Haymarket." https://www.dexus.com/investing/properties/atlassian-central-8-10-lee-street-haymarket.html
26. Charter Hall, "Chifley Two-Tower Precinct," March 2025. https://www.charterhall.com.au/News/news-article/2025/03/24/charter-hall-reaches-further-milestone-at-its--4-billion-chifley-two-tower-precinct